Virtual Protocol is currently on a roll, with a 14.55% daily decline and trading at $2.19. In the past 24 hours, the token has been highly volatile, switching between a low of $2.15 and a high of $2.72. At its all-time high three days ago, the VIRTUAL cryptocurrency was worth $3.29. However, it has fallen by 32.06%, indicating a price correction within the market.
Moreover, the 24-hour trading volume for the token amounts to $270.48 million, which has shrunk by 25.78%. Its market cap, on the other hand, is now $2.19 billion. Such figures reflect the pressure that the cryptocurrency feels yet also demonstrate the persistence of traders in this niche.
Retesting of the Critical Levels is possible
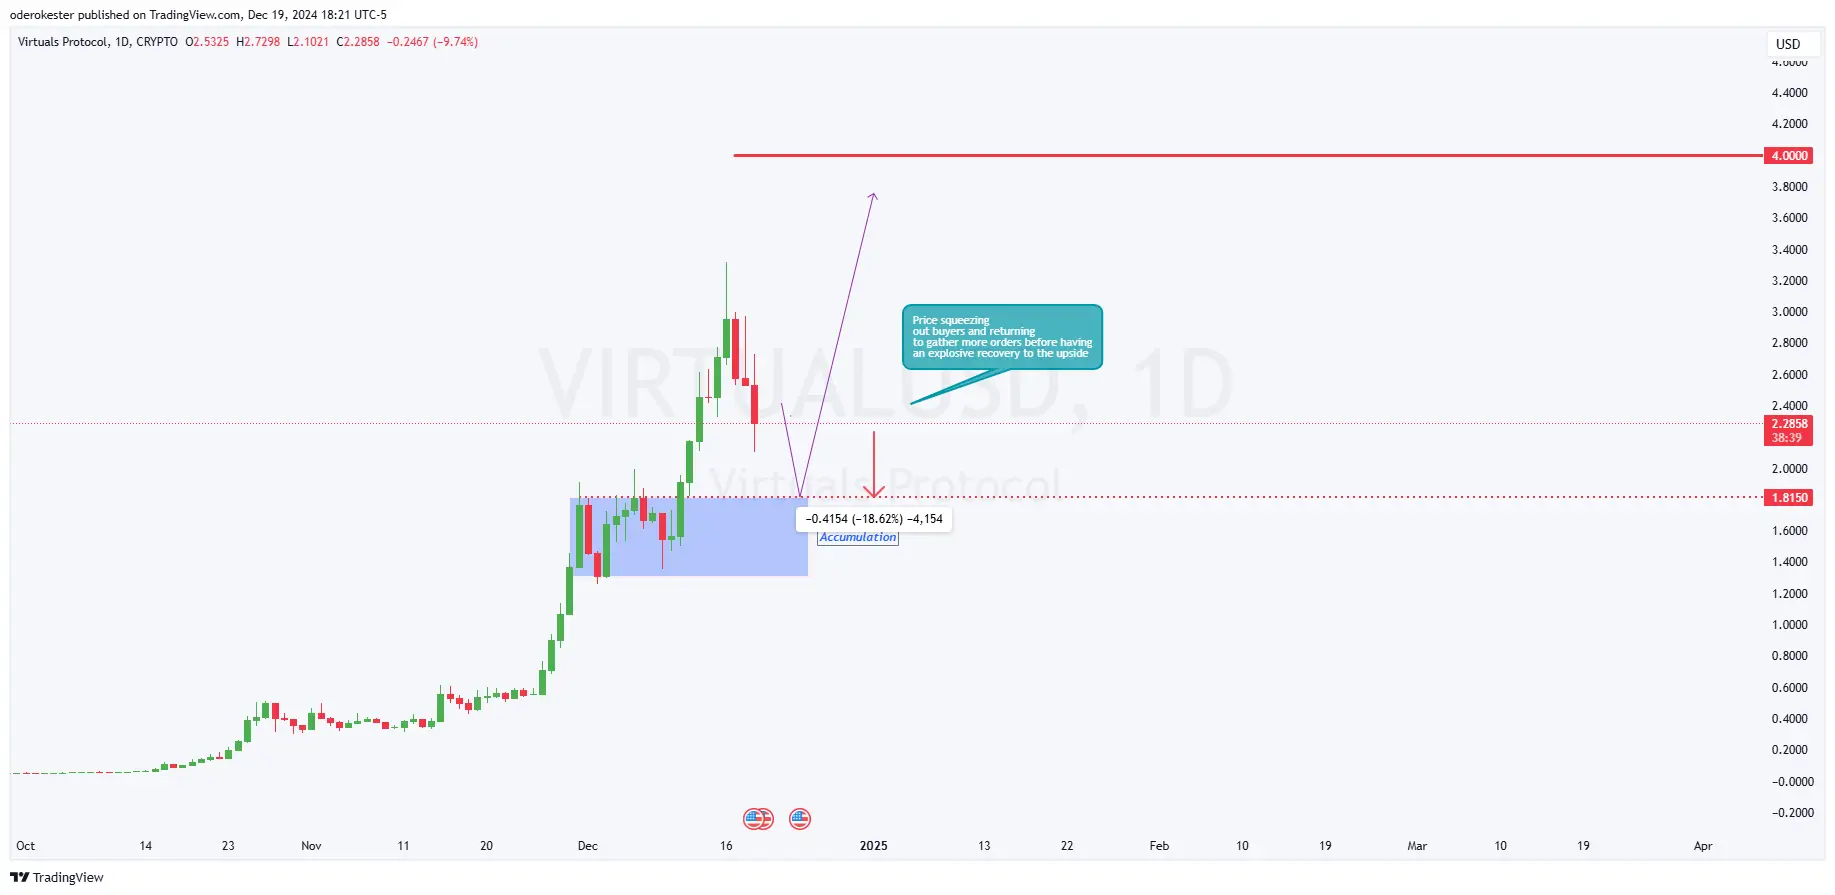
The VIRTUAL cryptocurrency is beginning to correct lower levels after recent highs and is correlated with the $1.815 level in consolidation. The retest zone here aligns with the prior breakout zone, a key support area where buyers could amass positions. Should an 18% decline to the $1.815 level bring early breakout buyers out, a possible recovery is anticipated to come into play for the cryptocurrency.

In short, a support at $1.815 would mean a bullish reversal with a target at $4 in the medium term. The accumulation phase is a typical market formation in which prices take a breather before resuming the growth of a new upward trend. This level is important, as the future direction of the token will be decided from there.
Indicators Show Signs of Stabilization and Reversal Potential
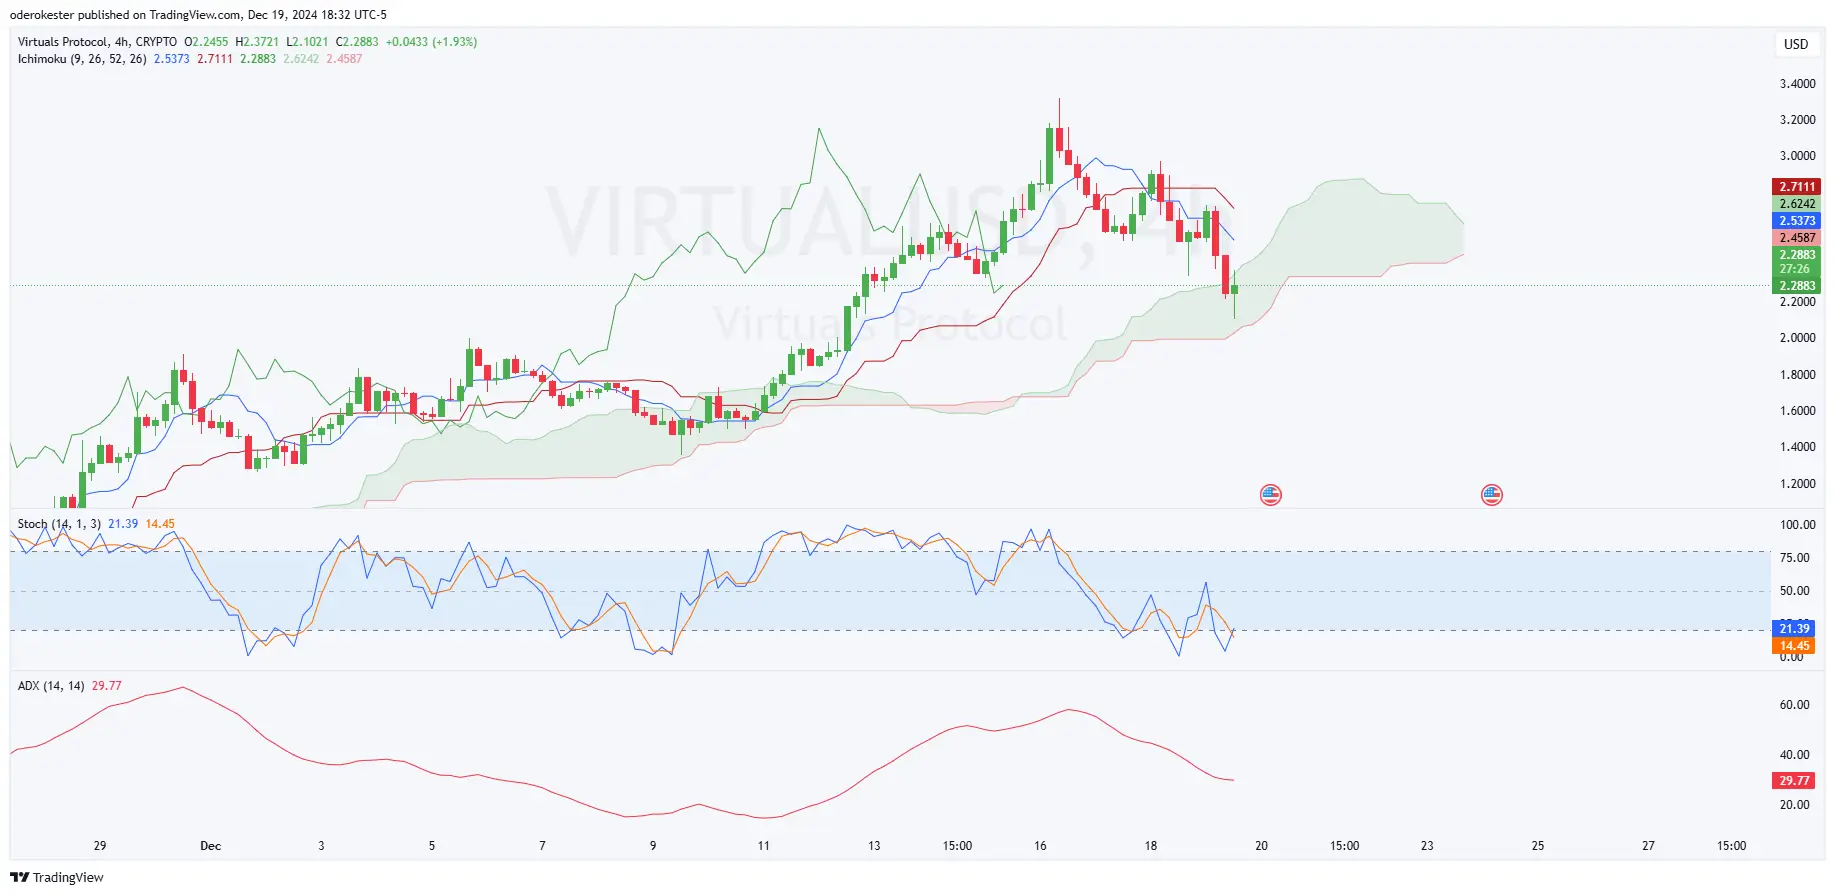
Key indicators show the Virtual Protocol token heading for consolidation before its next major price move. The Ichimoku Cloud analysis shows that the price is pinned against its lower boundary and is supported below $2.24. This conforms with the Kijun-Sen, a very important level that usually represents equilibrium and stabilization. The current reading at 21.39 is oversold, showing a flattening of bearish momentum and a likely bounce back.

At the same time, the Average Directional Index of 29.77 is close to showing that the downtrend strength is now declining. A break will be confirmed only once the price moves above $2.62, the next resistance level.
Liquidation Heatmap Key Levels to Watch
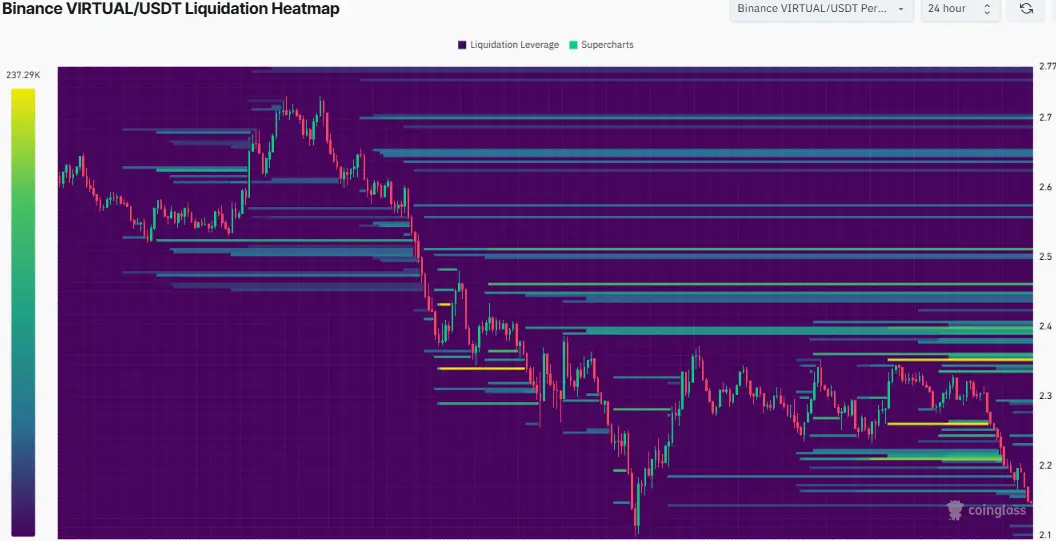
According to Coinglass, Virtual Protocol’s Binance USDT pairs see significant liquidation activity. The liquidation zones at $2.7 and $2.5 were seen to be big; 237.29K USDT in leverage was cleared at these levels. It manifests as traders being overleveraged and liquidations cascading as prices fall.

The lack of activity around $2.1 shows growing support as traders become accustomed to a lower price zone. Conversely, the heavier liquidation zones around $2.5 can potentially provide resistance if the price tries to recover.
Also Read: Is Pepe Coin Price Heading Below $0.00001? Whale Sell-off Sparks Fear
 cryptonewsz.com
