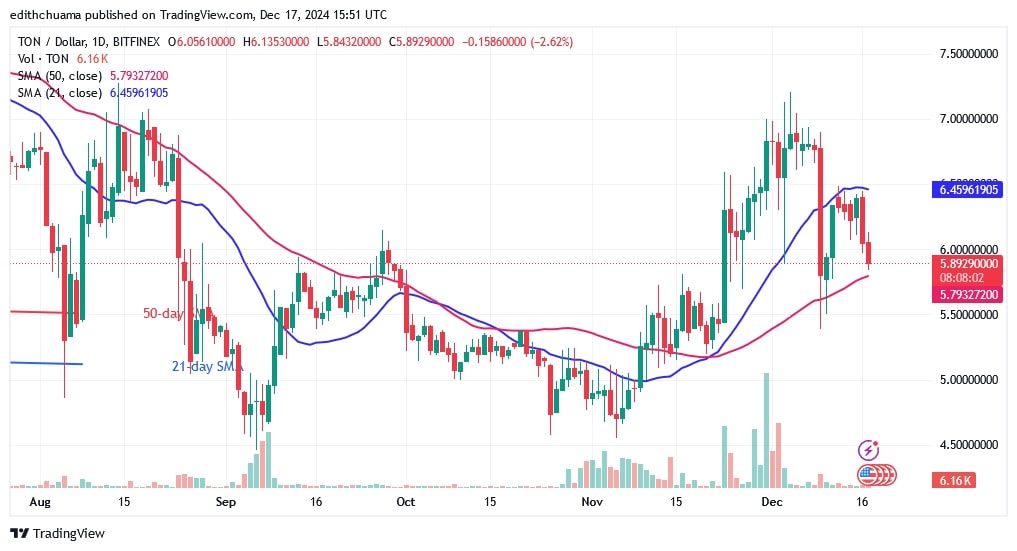
The price of Toncoin (TON) is slumping after failing to break above the $7.00 resistance.
Toncoin price long-term forecast: bullish
Had the positive trend continued above the $7.00 mark, TON would have returned to its high price of $8.00. Since December 9, the cryptocurrency has fallen and remained trapped between the moving average lines. Neither the bulls nor the bears have broken the moving average lines. If the bears break the 50-day SMA line, TON will continue to fall and reach a low of $4.50.
On the upside, TON will resume its uptrend once it breaks above the 21-day SMA. TON is currently valued at $5.93.
Toncoin indicator analysis
TON is trading in a tight range between the 21-day SMA support and the 50-day SMA resistance. When the moving average lines are breached, the altcoin starts to trend down. On the downside, the price bars are below the moving average lines, indicating a decline.
Technical Indicators
Resistance Levels: $6.00, $8.00, $10.00
Support Levels: $5.00, $3.00, $1.00

What is the next step for Toncoin?
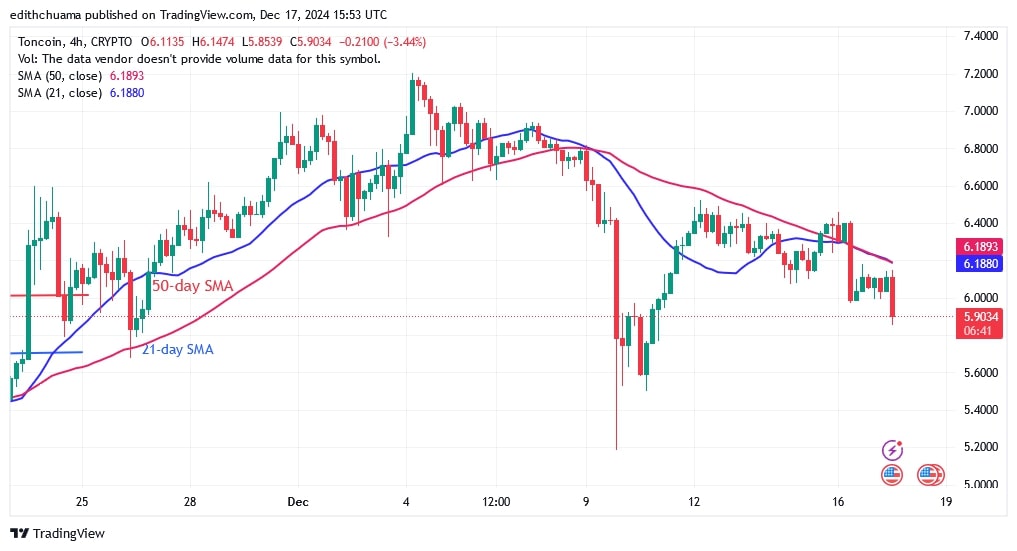
On the 4-hour chart, TON falls below the moving average lines. The altcoin is trading above the $5.60 support but below the $6.40 resistance. Once TON breaks out of its trading range, it will turn into a trend. The presence of doji candlesticks has caused the price action to remain stationary.

Coinidol.com reported last week that Toncoin's price recovery was hindered as it fell below the moving average lines after reaching a high of $7.00.
Disclaimer. This analysis and forecast are the personal opinions of the author, are not a recommendation to buy or sell cryptocurrency, and should not be viewed as an endorsement by CoinIdol.com. Readers should do their research before investing in funds.
 coinidol.com
