$XRP is trading at $2.41, with an intraday range of $2.38 to $2.52, a market cap of $137.70 billion, and a 24-hour trading volume of $8.77 billion, highlighting a phase of consolidation.
$XRP
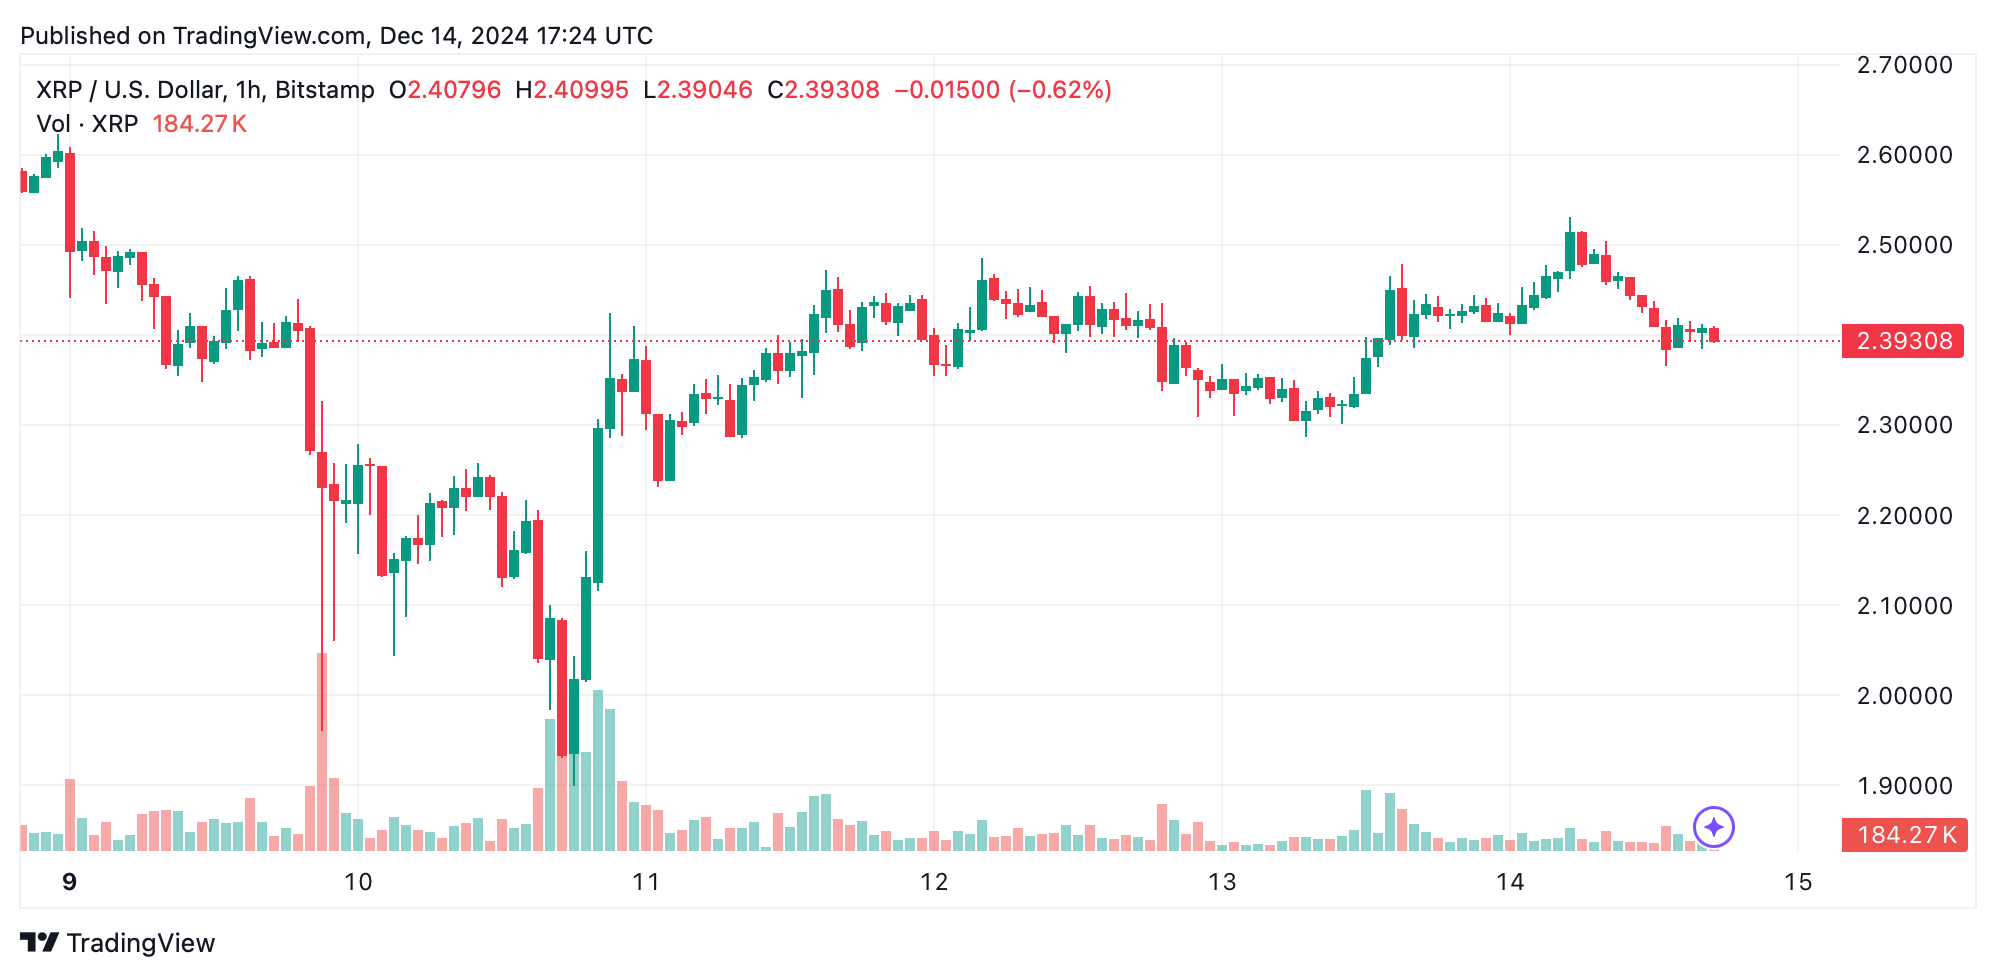
On the 1-hour chart, $XRP shows a short-term downtrend following a retreat from a local high of $2.531 to its current level near $2.41. The price is stabilizing in the $2.38–$2.40 range, which acts as a key support zone, while resistance looms at $2.48–$2.50. Reduced trading volume after a recent decline suggests diminished selling pressure and possible consolidation. Traders may consider entering near support if accompanied by rising volume, targeting the $2.50 level.

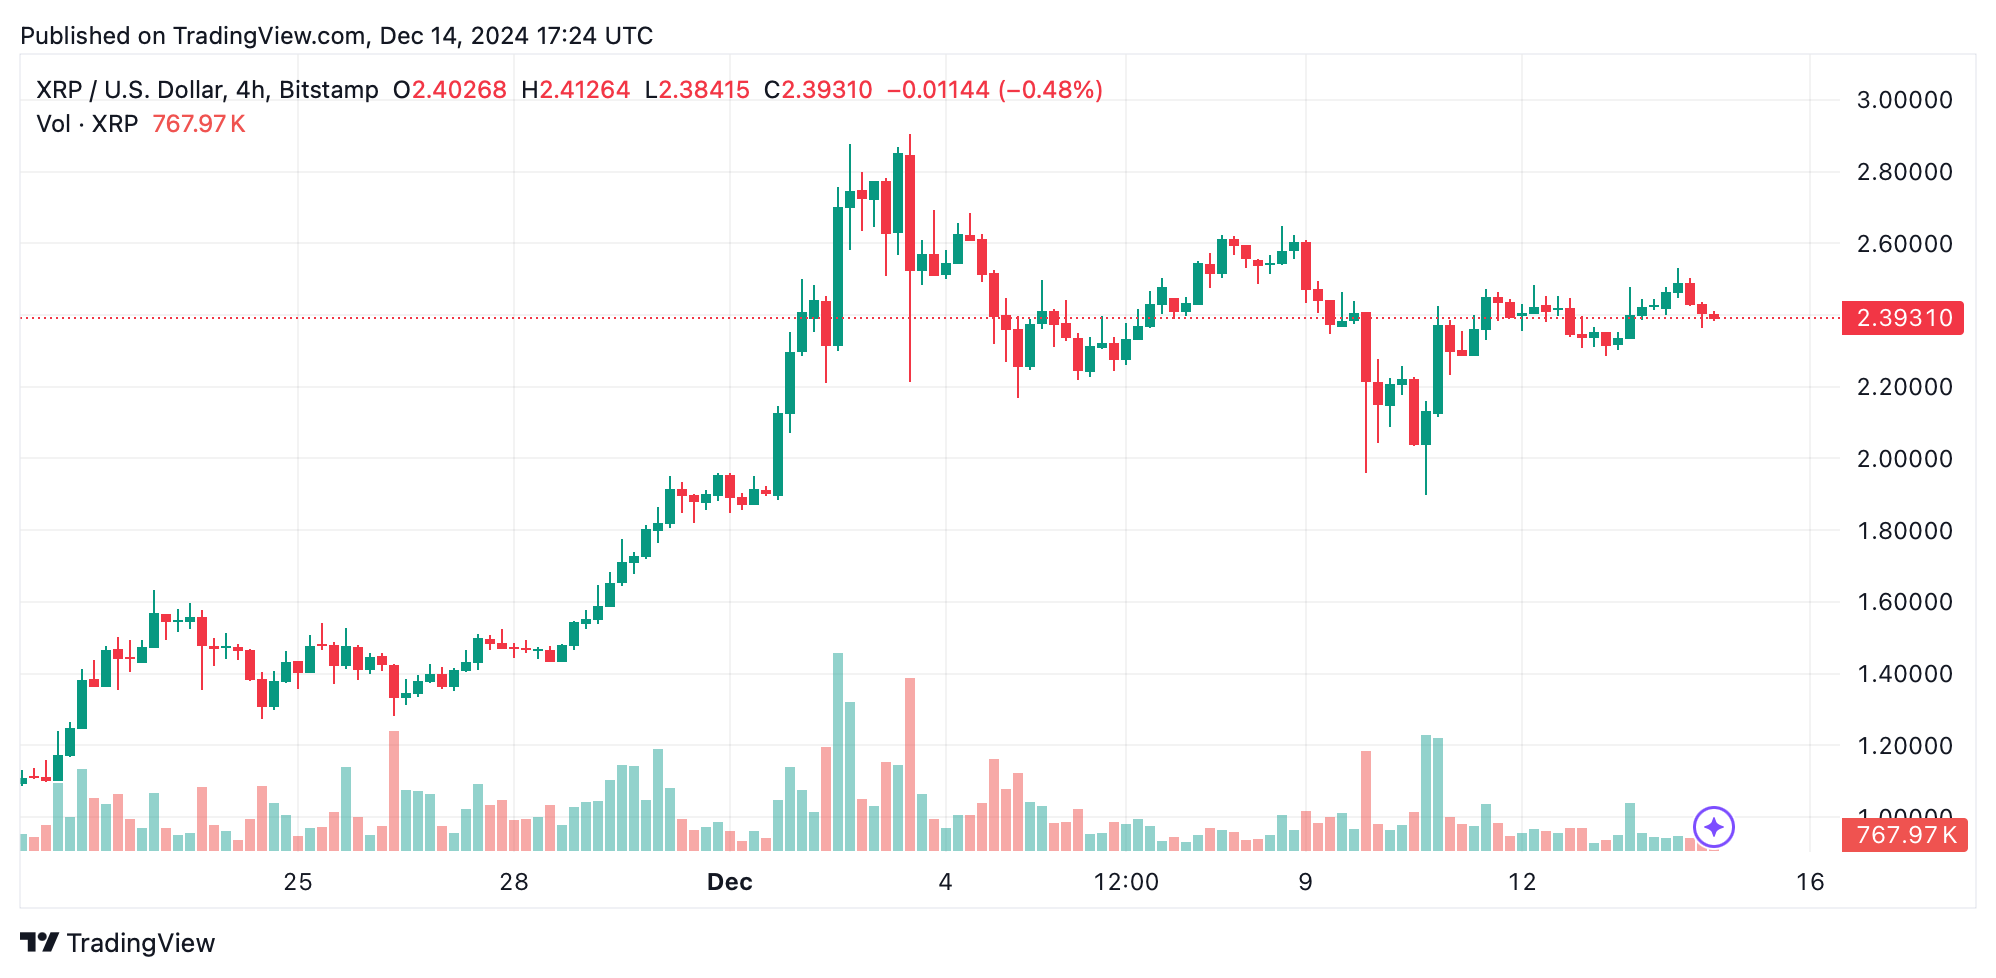
The 4-hour chart reveals $XRP consolidating between $2.30 and $2.50 after a sharp recovery from a recent low of $1.898. Strong support resides near $2.30, with additional demand zones around $2.10–$2.20. Resistance is evident between $2.50 and $2.60. A breakout above $2.50 could indicate a bullish continuation, while a breach below $2.30 might signal further downside. Traders eyeing mid-term positions may wait for confirmed moves beyond these levels.

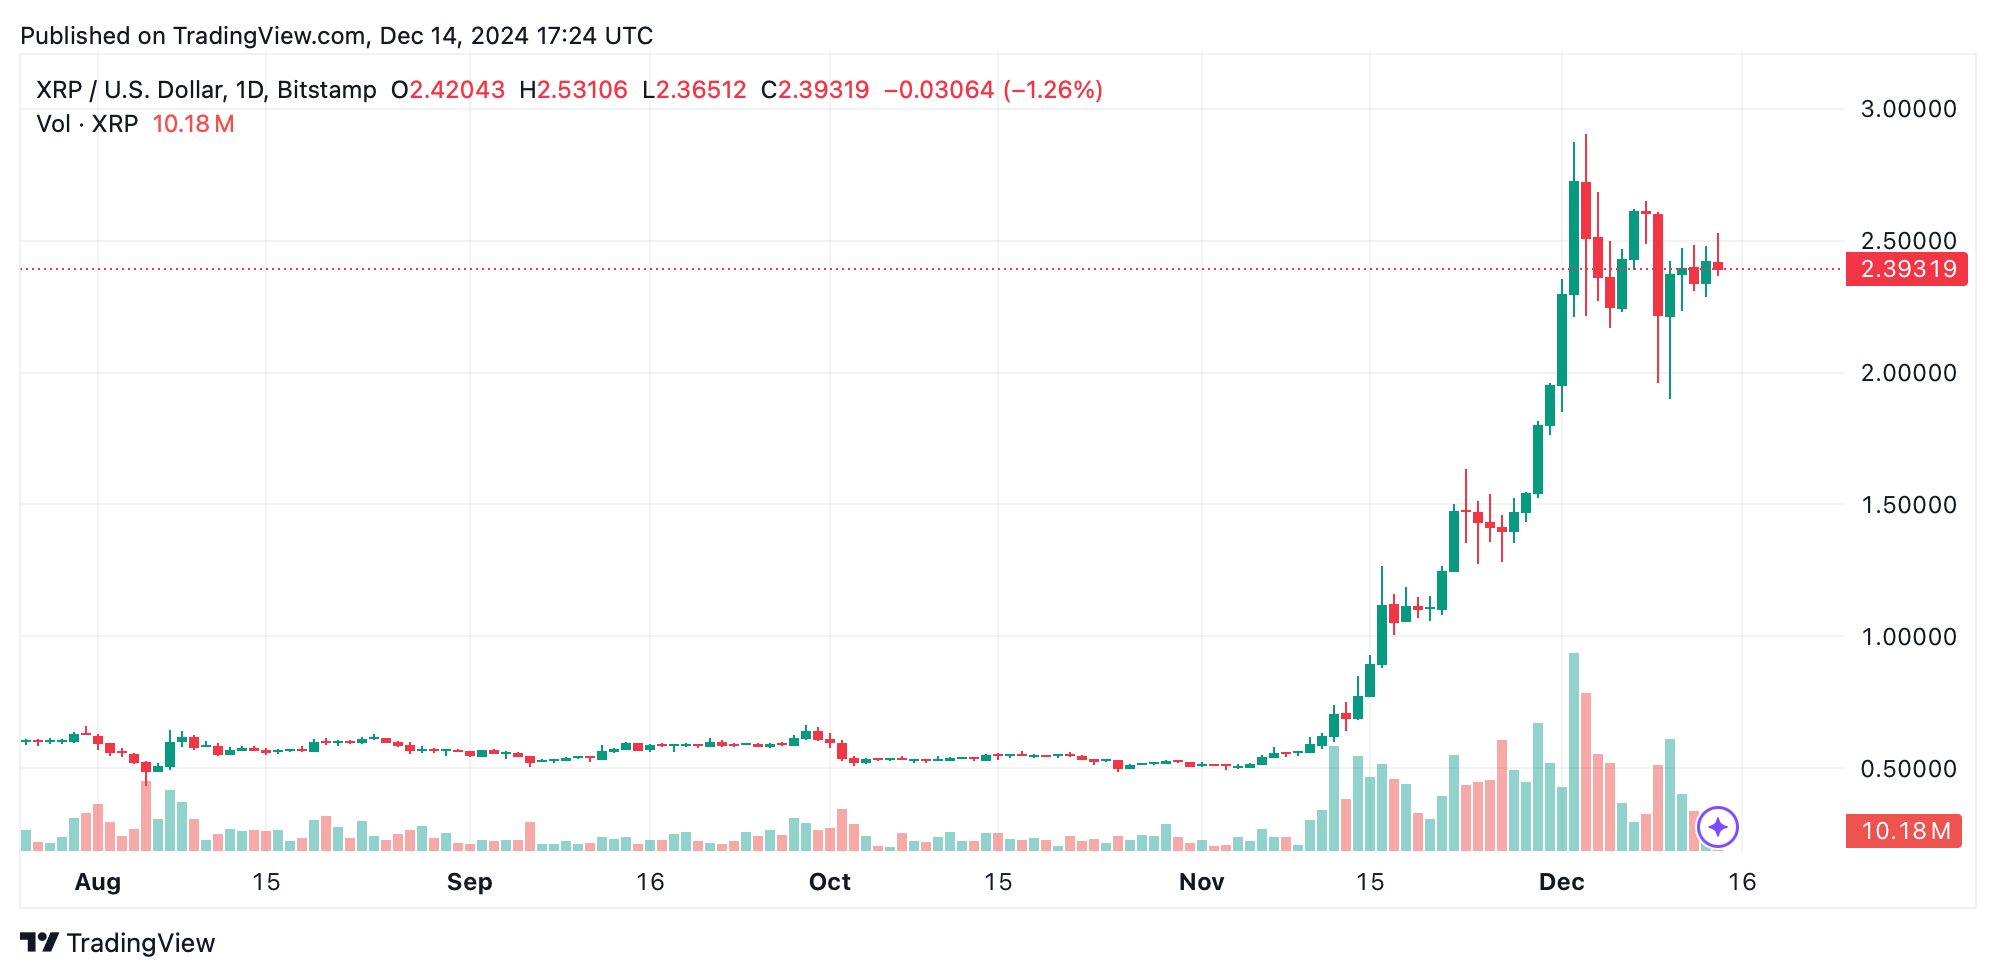
$XRP’s daily chart portrays a broader rally from $0.5441 to a peak of $2.909, followed by a pullback into the $2.40–$2.50 consolidation zone. Key support levels are visible at $2.20 and $2.00, while resistance ranges from $2.60 to $2.90. The reduced trading volume during consolidation suggests waning momentum but offers a potential buying opportunity if $2.20 holds firm. A breakout above $2.60 could lead $XRP toward retesting its recent highs.

$XRP’s oscillators provide neutral to bullish signals, with the relative strength index (RSI) at 64.15, Stochastic at 56.37, and momentum at 0.04736 indicating optimism. However, the moving average convergence divergence (MACD) level at 0.31878 signals negative action. Moving averages (MAs) show a strong bullish trend, as exponential moving averages (EMAs) for 10, 20, and 50 periods and simple moving averages (SMAs) for the same periods all reflect positive signals.
Bull Verdict:
$XRP’s consolidation near $2.40, combined with strong support levels and bullish moving averages, suggests the potential for a breakout above $2.50. If buying volume increases and the broader market sentiment remains positive, $XRP could retest $2.60 and potentially aim for its recent high near $2.90, reaffirming its bullish momentum.
Bear Verdict:
A failure to hold support at $2.38, coupled with the sell signal from the moving average convergence divergence (MACD), could lead to a deeper retracement toward $2.20 or even $2.00. Lower trading volumes during consolidation might also indicate waning bullish strength, setting the stage for bearish momentum to dominate.
 news.bitcoin.com
