This prediction appears achievable, as $SOL is poised for a massive rally, having formed a bullish price action pattern.
Solana’s ($SOL) Bullish Breakout Levels to Watch
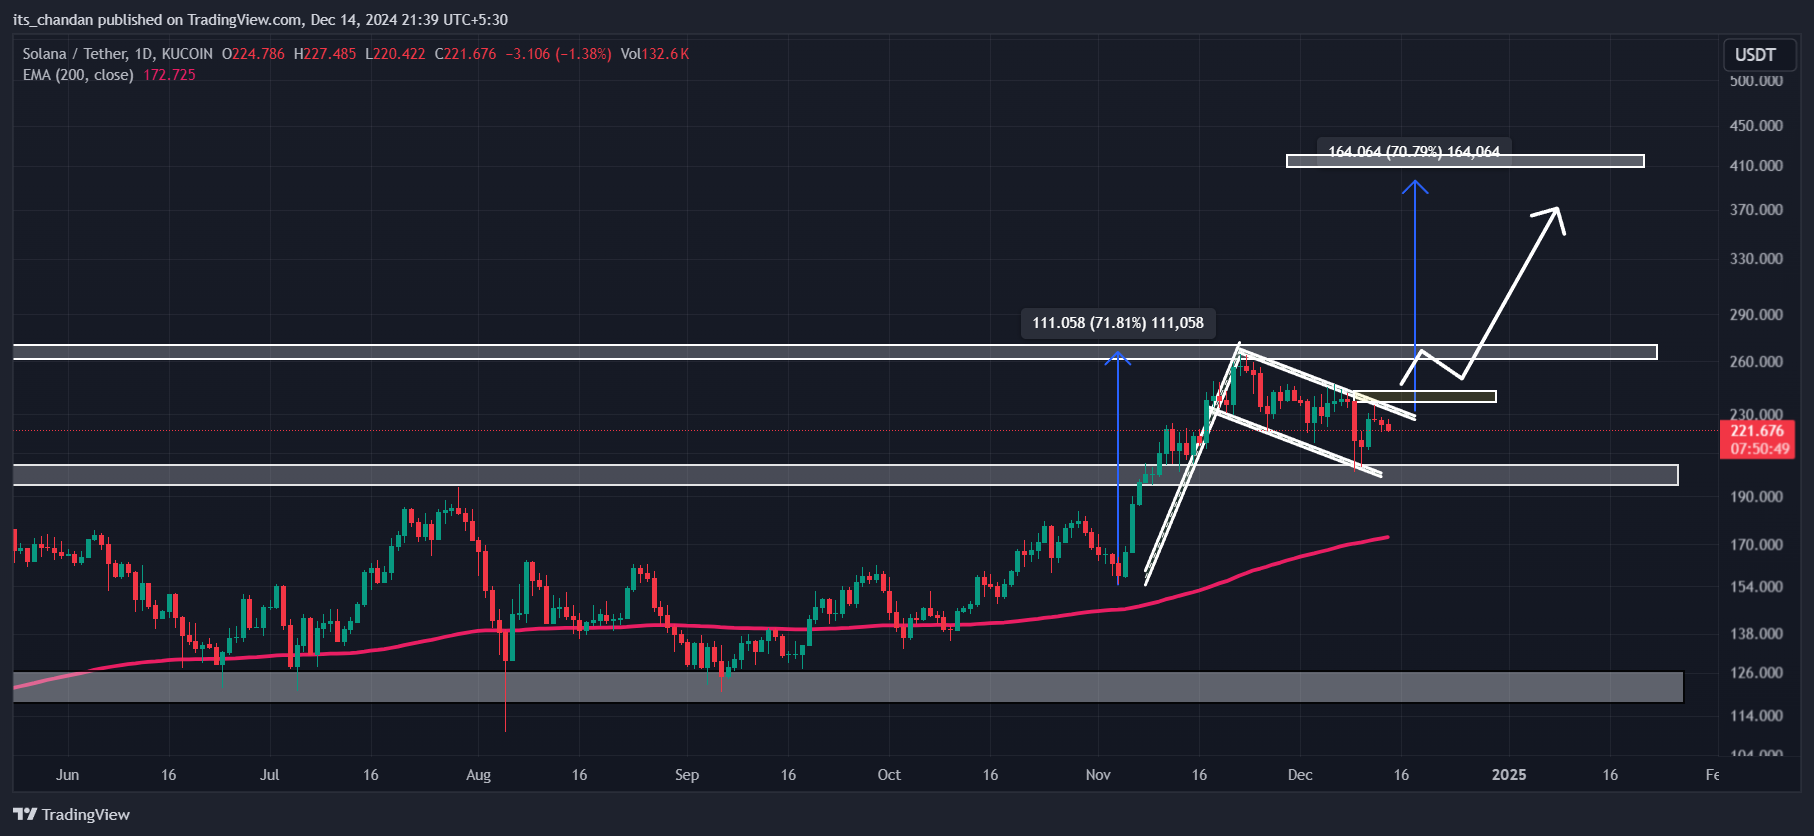
According to expert technical analysis, $SOL has been consolidating for over three weeks and has formed a bullish flag-and-pole price action pattern on the daily timeframe. A flag-and-pole is a price action pattern that traders and investors use to build long positions over different time periods if the price breaches or breaks out of the pattern.
Source: Trading View
However, $SOL appears to be struggling to break out of this pattern. According to technical analysis, if $SOL successfully breaks out and closes a daily candle above the $236 level, there is a strong possibility it could soar by 70% to reach the $415 level in the coming days.
Additionally, $SOL’s Relative Strength Index (RSI) is currently near the oversold region, indicating that the asset is poised for upside momentum.
This bullish thesis will remain valid only if $SOL breaks out of this price action pattern and closes a daily candle above the $236 level; otherwise, it may fail.
81% of Traders Long on $SOL
$SOL’s technical analysis is further supported by on-chain metrics. According to the on-chain analytics firm Coinglass, the Binance SOLUSDT long/short ratio currently stands at 4.28, indicating strong bullish sentiment among traders. At present, 81.05% of top Binance traders hold long positions, while only 18.95% hold short positions.
These on-chain metrics and technical analysis indicate that the bulls are currently dominating the asset, which could support $SOL in breaching the bullish pattern.
Current Price Momentum
At press time, $SOL is trading near $222 and has experienced a price decline of 0.75% in the past 24 hours. Additionally, its trading volume has dropped by 24% during the same period, indicating reduced participation from traders and investors compared to the previous day.

 coinpedia.org