Ripple is quickly approaching its all-time high price against the US Dollar while also appreciating against Bitcoin, as $XRP investors are finally reaping the rewards for their patience over the last few years.
$XRP Price Analysis
By Edris Derakhshi (TradingRage)
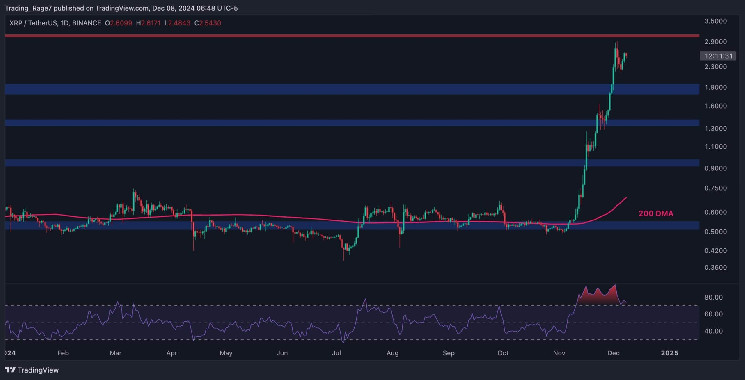
The $USDT Paired Chart
On the $USDT-Paired chart’s daily timeframe, it is evident that $XRP’s price has been rallying almost vertically, breaking past several resistance levels.
As it is approaching its all-time high value, set in 2018, investors are hoping for a $5 Ripple in the coming months.
However, the RSI is showing a concerning overbought signal that could lead to a lengthy consolidation or correction, likely after a new record high is set.
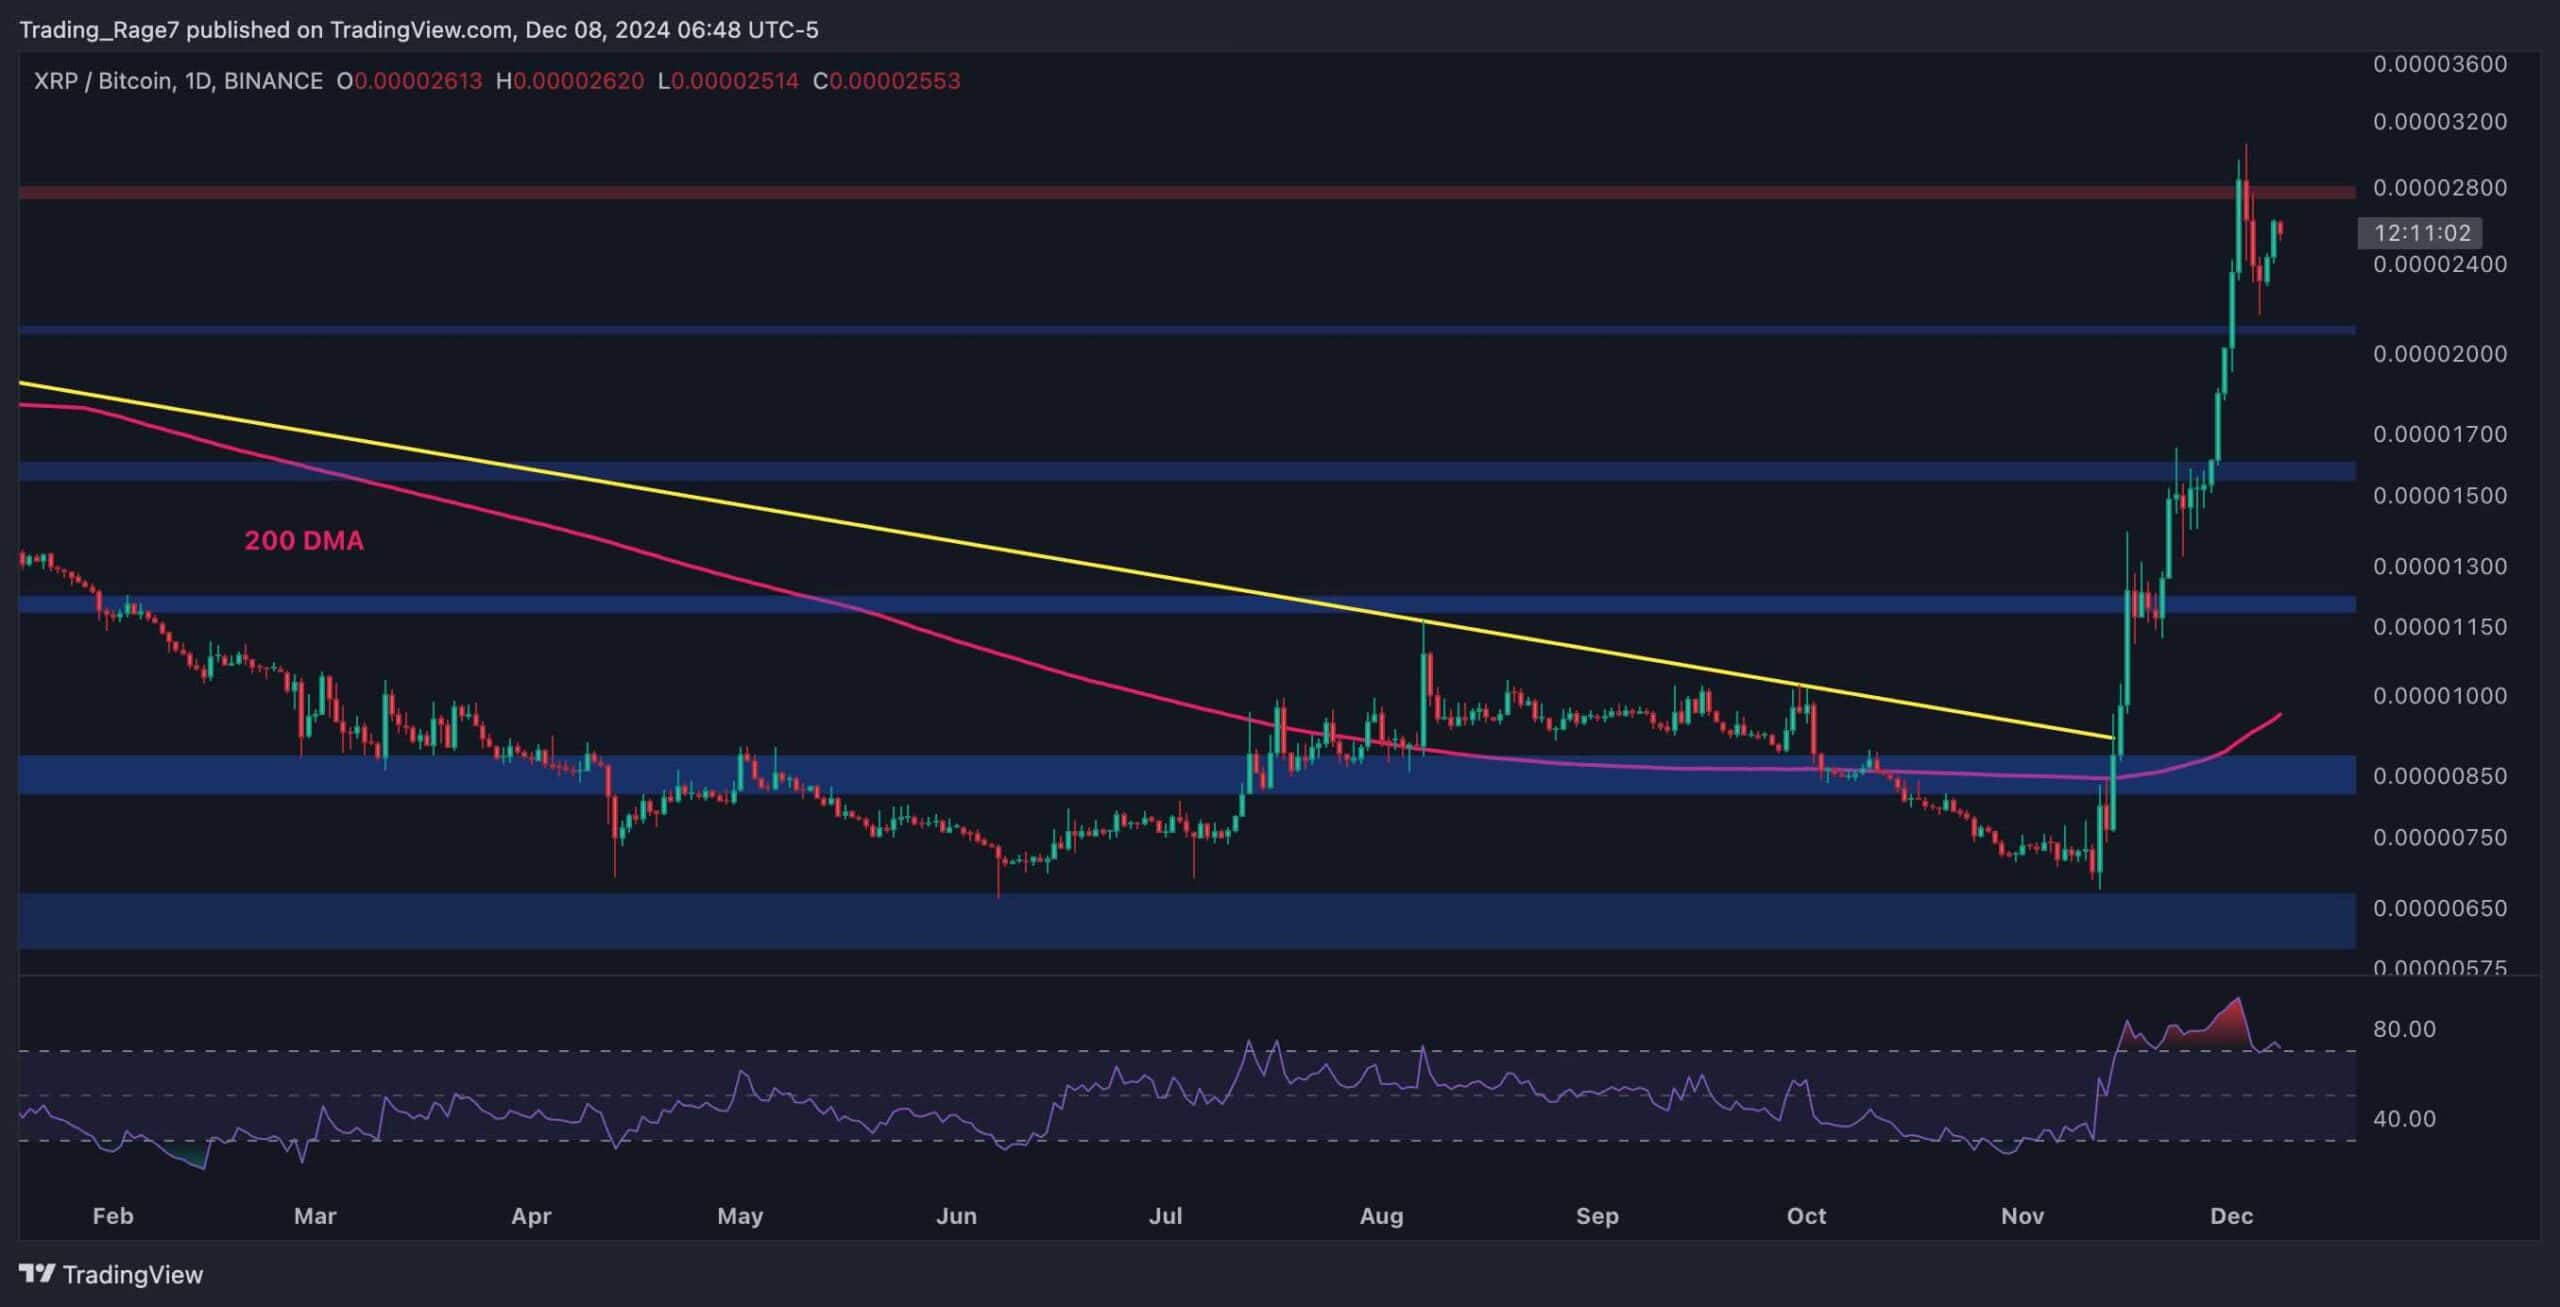
The $BTC Paired Chart
The $XRP/$BTC chart better demonstrates Ripple’s massive rise in value. It’s important to note that $XRP is rising against Bitcoin, which has also been rallying.
This uptrend began following the breakout above the 200-day moving average and the long-term bearish trendline, but the 2800 SAT resistance level is currently preventing a further continuation.
The RSI shows a similar overbought signal on the $BTC-paired chart, suggesting that a period of consolidation or correction will likely occur.