Market veteran Raoul Pal has drawn parallels between the Dogecoin chart and that of XRP, suggesting that DOGE is poised for a similarly bullish trajectory.
Pal presented his analysis amid the ongoing market uncertainty. Notably, DOGE has failed to make any decisive move since Nov. 12, consolidating between the $0.48 top and the $0.34 low over the past several weeks.
DOGE Could Rally Like XRP
Raoul Pal presented a 1-month chart, which shows three falling wedge formations. The first wedge occurred between 2014 and 2017, leading to a breakout that resulted in a major rally. This coincided with Dogecoin’s first major market cycle.
The second wedge, occurring between 2018 and 2021, also culminated in a dramatic breakout, propelling DOGE to its all-time high near $0.74 during the 2021 bull market.
Meanwhile, the third and current wedge pattern extends from mid-2021 to 2024. Recently, DOGE has broken out of this wedge, suggesting a potential continuation of the historical uptrend.
Pal suggests Dogecoin could experience a massive rally, with this view mirroring his previous bullish outlook on XRP, which also experienced impressive gains following its breakout from a similar structure.
Analysts Bullish on Dogecoin
Other market analysts are also bullish on DOGE. Market analyst Trader Tardigrade recently highlighted the formation of a bullish pennant, which represents a continuation pattern that usually precedes price surges.
#Dogecoin Bullish Pennant stays there 🔥$Doge comes to the verge of the Pennant, looking to BREAKOUT soon.
Target: $1.35 🚀 pic.twitter.com/8cckOegKBI— Trader Tardigrade (@TATrader_Alan) December 6, 2024
According to Tardigrade, Dogecoin is nearing the apex of this pennant, indicating an imminent breakout. He foresees a target price of $1.35. This level syncs with the scale of the projected rally, aligning with Pal’s prediction of substantial upward potential.
CW, another prominent market analyst, identified an AB=CD harmonic pattern on Dogecoin’s 4-hour chart. This pattern, which started during the early November rally following Donald Trump’s election victory, further supports the bullish case.
$DOGE is the main resistance line in the B price range.
If they break through, it looks like further upside will begin.
The target price is still $0.69. pic.twitter.com/LZ4ccDppVo
— CW (@CW8900) December 6, 2024
The market analyst highlights $0.69 as a major target price, contingent on DOGE breaking through a major resistance line in the $0.40-$0.50 range.
Dogecoin’s Current Position
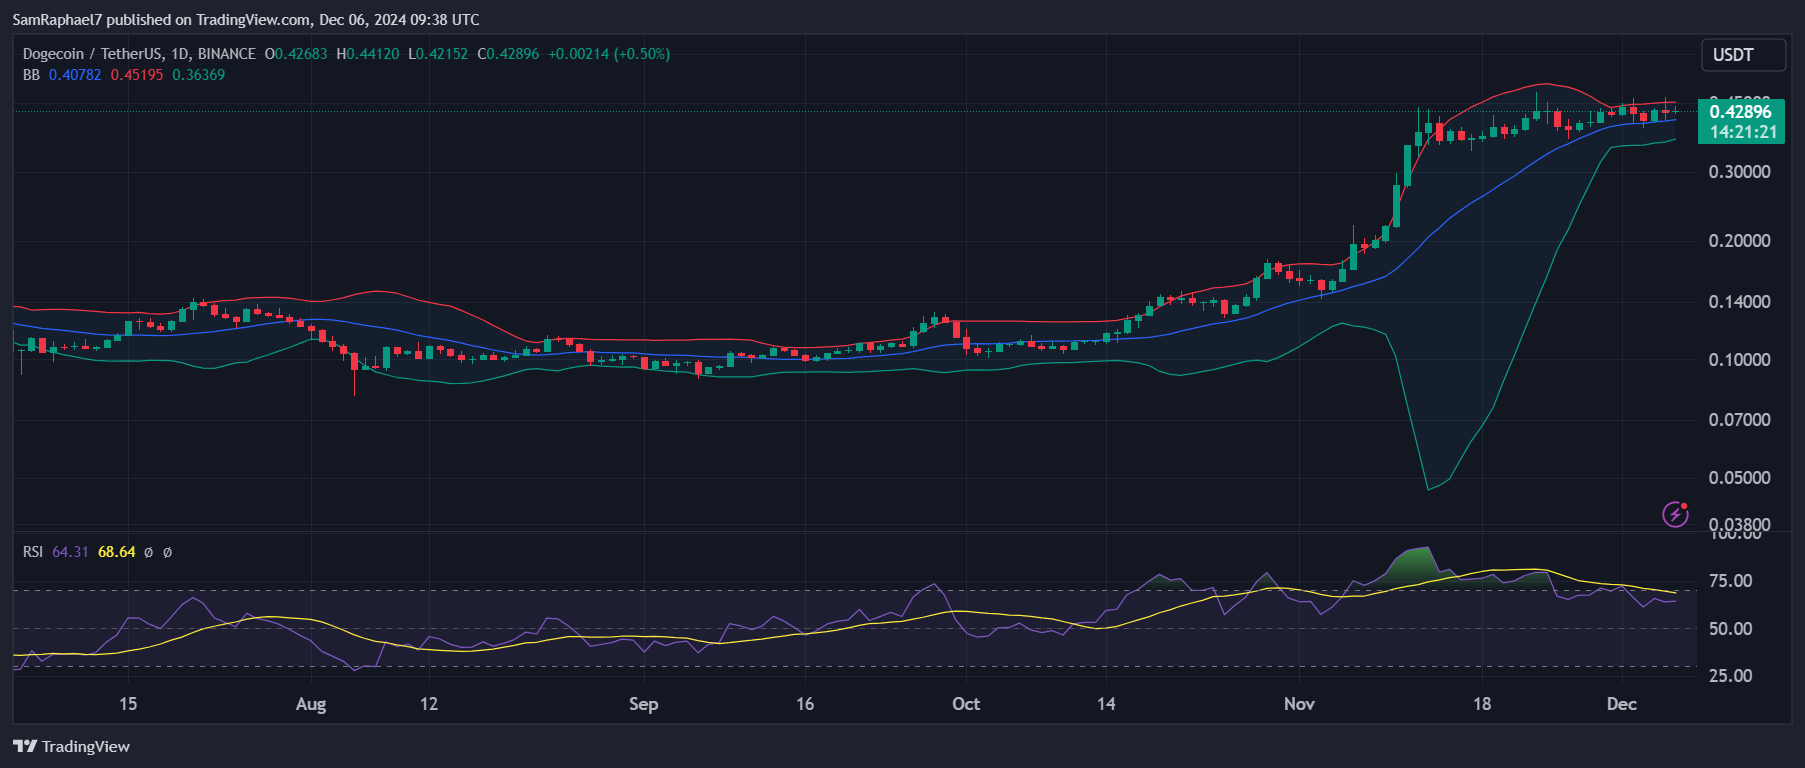
Meanwhile, the daily chart shows Dogecoin’s consolidation phase. DOGE now trades for $0.4289, reflecting a period of relative calm after its recent rally. The Bollinger Bands show DOGE consolidating near the upper band at $0.4519, a level that could lead to further uptrend if the asset breaches it.

However, failure to maintain support at the midline ($0.4076), aligned with the 20-day moving average (MA), could lead to a retracement, threatening the short-term bullish outlook. The RSI, currently at 63.37, indicates that DOGE has room to grow before reaching overbought territory.
 thecryptobasic.com