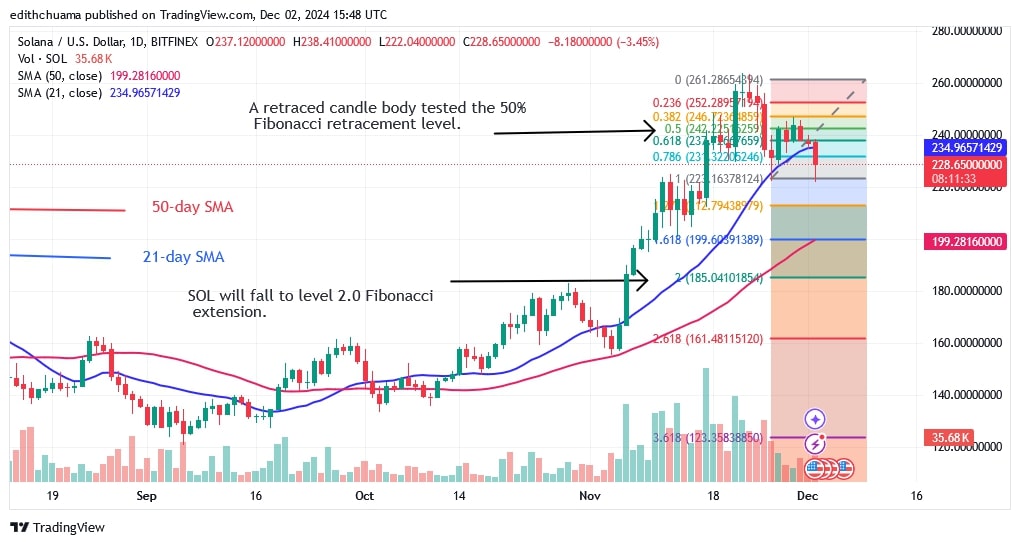
Solana (SOL) price has resumed selling pressure after reaching the overhead resistance level of $260.
Solana price long term prediction: bearish
The selling pressure has been reiterated as the altcoin faces further rejection at its high of $240. Moreover, the bears have broken the 21-day SMA support, suggesting that the cryptocurrency will continue to fall.
On November 26, a retraced candlestick body approached the 50% Fibonacci retracement level. The retracement pattern shows that Solana will continue to fall to the low of the 2.0 Fibonacci extension, i.e. $185.
Meanwhile, the altcoin is falling slightly to the downside. Solana is now valued at $228.
SOL price indicator analysis
Solana is slipping below the 21-day SMA but is still above the 50-day SMA. The cryptocurrency is stuck between two moving average lines. It is currently approaching the 50-day SMA support. Despite the decline, the moving average lines are still leaning north.
Technical indicators
Key supply zones: $200, $220, $240
Key demand zones: $120, $100, $80

What's the next move for Solana?
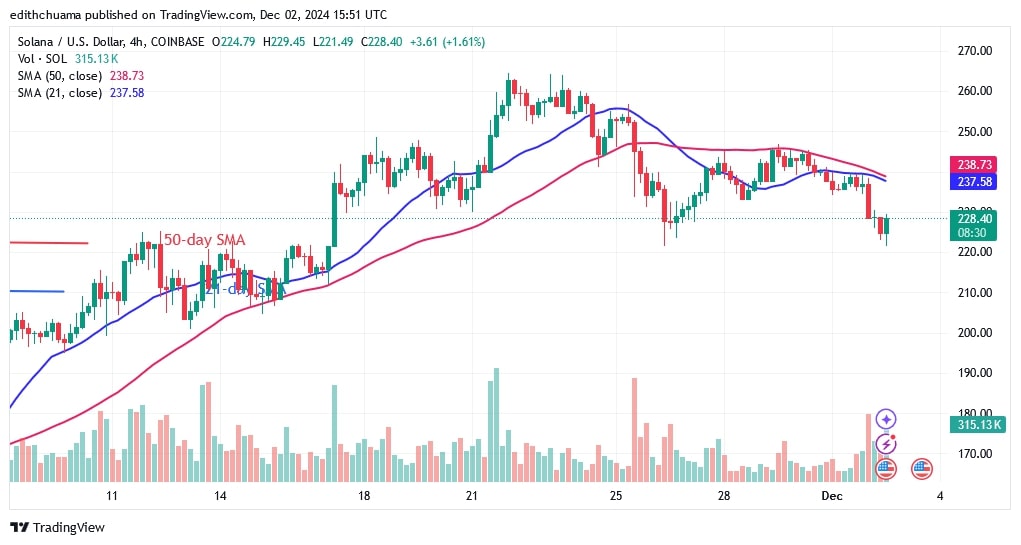
On the 4-hour chart, Solana has fallen below the moving average lines, indicating that the price of the cryptocurrency will continue to fall. Indecisive candlesticks with small bodies dominate price activity, resulting in the altcoin trading at a low level. According to the price indication, the market will reach a low of $185.

Disclaimer. This analysis and forecast are the personal opinions of the author, are not a recommendation to buy or sell cryptocurrency, and should not be viewed as an endorsement by CoinIdol.com. Readers should do their research before investing in funds.
 coinidol.com