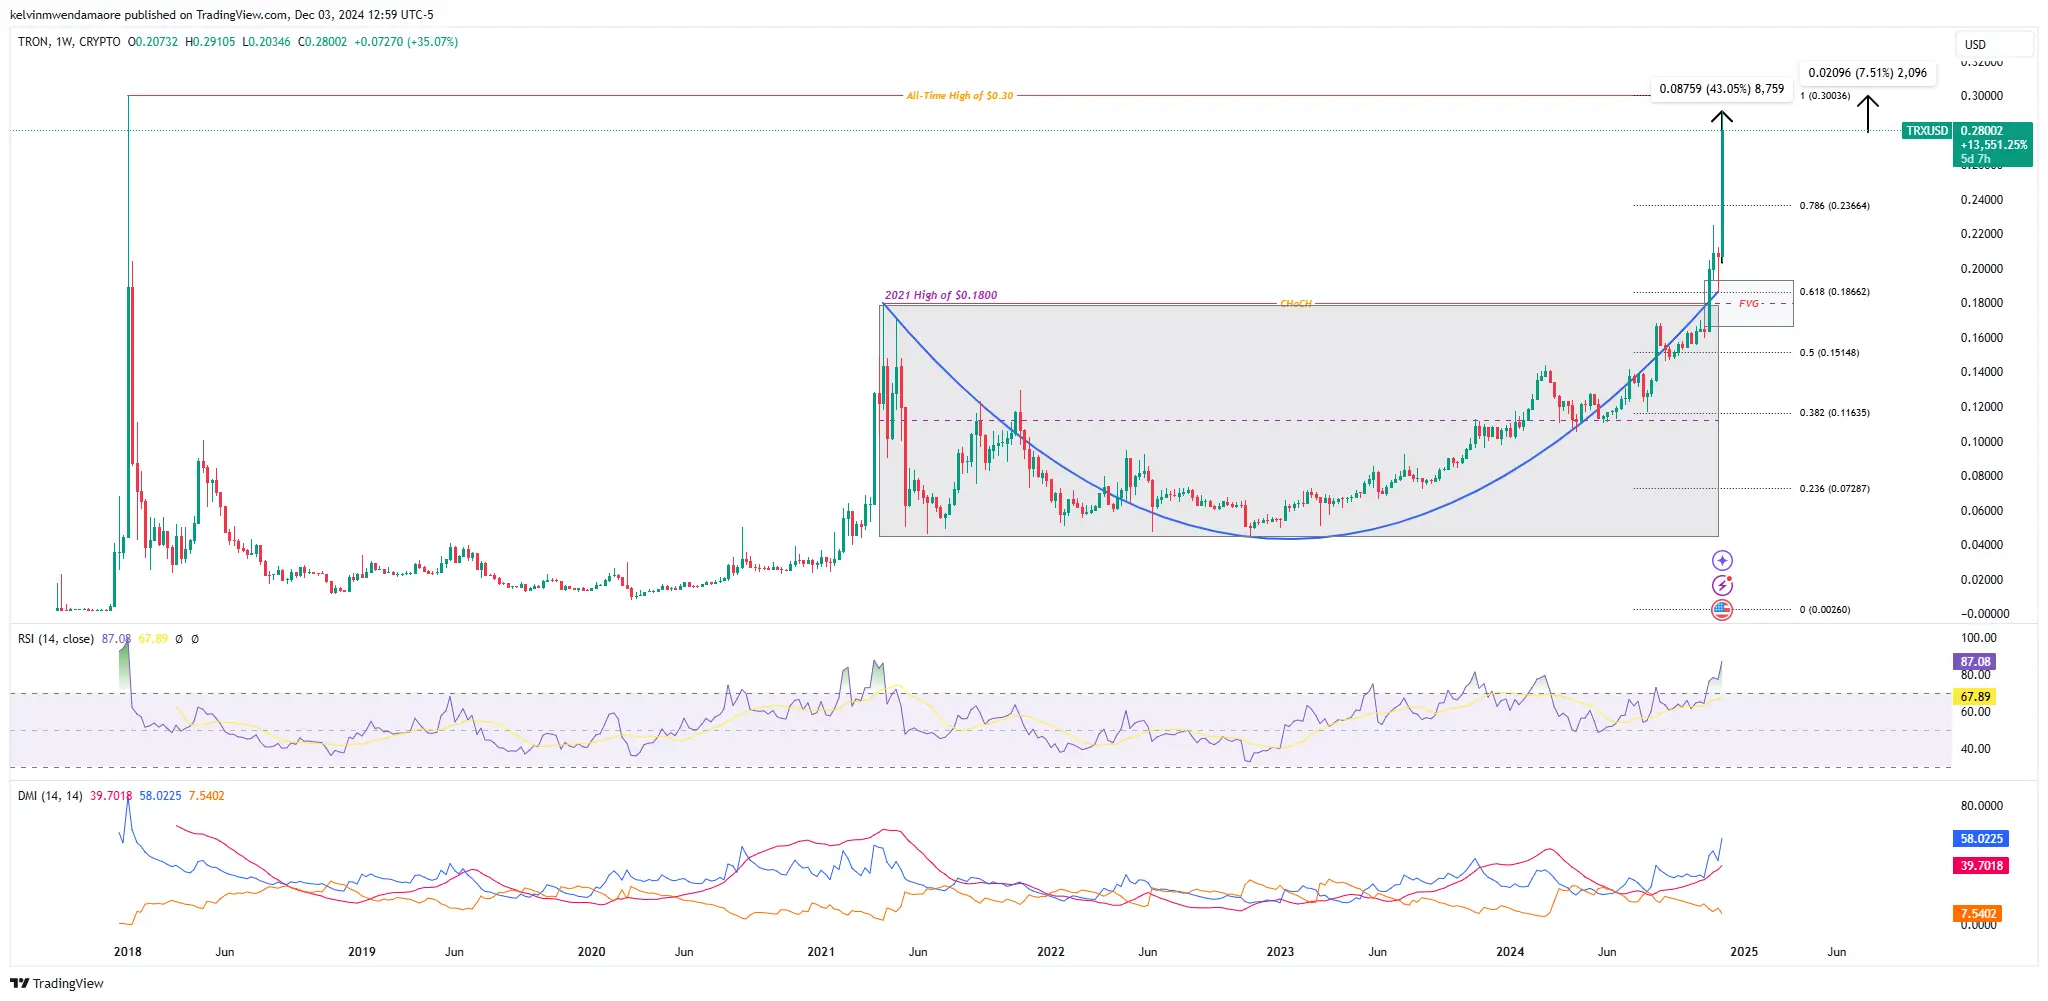
Tron’s native token, TRX, has experienced its market value surge to a 6-year high of $0.2910, marking a 43.06% gain since the beginning of December. This rally has positioned the cryptocurrency on the verge of retesting its all-time high of $0.3004, just 7.51% above its current level. A key technical pattern driving this surge is the formation of a rounded bottom, indicative of a sustained bullish reversal.
This pattern, spanning over two years, shows the altcoin’s steadily building momentum, resulting in its breakout above the documented $0.18 resistance level. Following this change in market character, the TRX token has also breached the key 0.786 Fibonacci retracement level at $0.2366, confirming the bullish strength.

Moreover, the fair value gap between $0.1865 and $0.2364 highlights an imbalance in price action, further supporting upward movement above its ATH of $0.30. Historically, such patterns have preceded major rallies, suggesting this December could mark a vital moment for the asset.
Despite this market optimism, the cryptocurrency has slightly rebounded, trading at $0.2800 at press time, recording a 34.84% uptick. Not to be outdone, its 24-hour trading volume garnered over 288% to reach the $5.66 billion mark, while its market cap sits at $24.67 billion, positioning it in the 11th spot in the cryptocurrency ranking.
TRX’s Technical Indicators Hint at a Bullish Outlook
The token’s 1-week technical indicators are currently aligning with this optimistic outlook. The relative strength index, for instance, stands at 87.08, signaling overbought conditions but also reflecting intense buying pressure. Historically, the last time TRX’s RSI remained in overbought conditions, the token soared to its all-time high. If history indicates, the cryptocurrency could again surpass its previous peak and establish a new record by the end of December.
The directional movement index further displays bullish sentiment, with the +DI at 58.0225 outpacing the -DI at 7.5402. This disparity signals strong bullish control over the market. Additionally, the average directional index at 39.7018 confirms the solidity of the current uptrend, hinting at a possible continuation in the coming days.

Adding to the optimism, the TRX Open Interest (OI) Weighted Funding Rate chart has shown a shift in sentiment over the past few months. Once predominantly negative, funding rates have turned positive, indicating that long positions are now in control as traders show an increased willingness to pay a premium to maintain their bullish bets. This transition reflects growing confidence among traders in TRX’s price trajectory, with bullish sentiment steadily building.
TRX Sets Sights on $0.48 Milestone
Given the bullish sentiment and momentum, TRX’s next target is $0.48, corresponding to the 1.618 Fibonacci extension level. A successful breach of the all-time high ($0.30) and sustained buying pressure could propel it toward this milestone.
Conversely, failure to hold above $0.2366 (0.786 Fibonacci retracement) might lead to a retest of support at $0.18, the breakout level of the rounded bottom. This correction could provide a healthy consolidation phase before resuming its upward trajectory. With increased trading volumes and strong market confidence, the bias remains bullish unless macroeconomic or fundamental factors shift sentiment.
 cryptonewsz.com
