While Solana (SOL) trades at $235, down 10.13% from its ATH, a bullish “cup and handle” pattern signals potential growth.
Solana has registered a notable price decline after hitting an all-time high of $263.21 on November 23. At the time of writing, SOL is worth $235.21, with a slight 0.1% increase over the last 24 hours.
However, on the 14-day and 30-day timeframes, Solana maintains more significant upward momentum, with gains of 6% and 30%, respectively.
Now, analysts and on-chain metrics suggest that Solana is riding a broader bullish trend, supported by positive technical indicators and growing ecosystem developments.
Technical Patterns Indicate Bullish Continuation
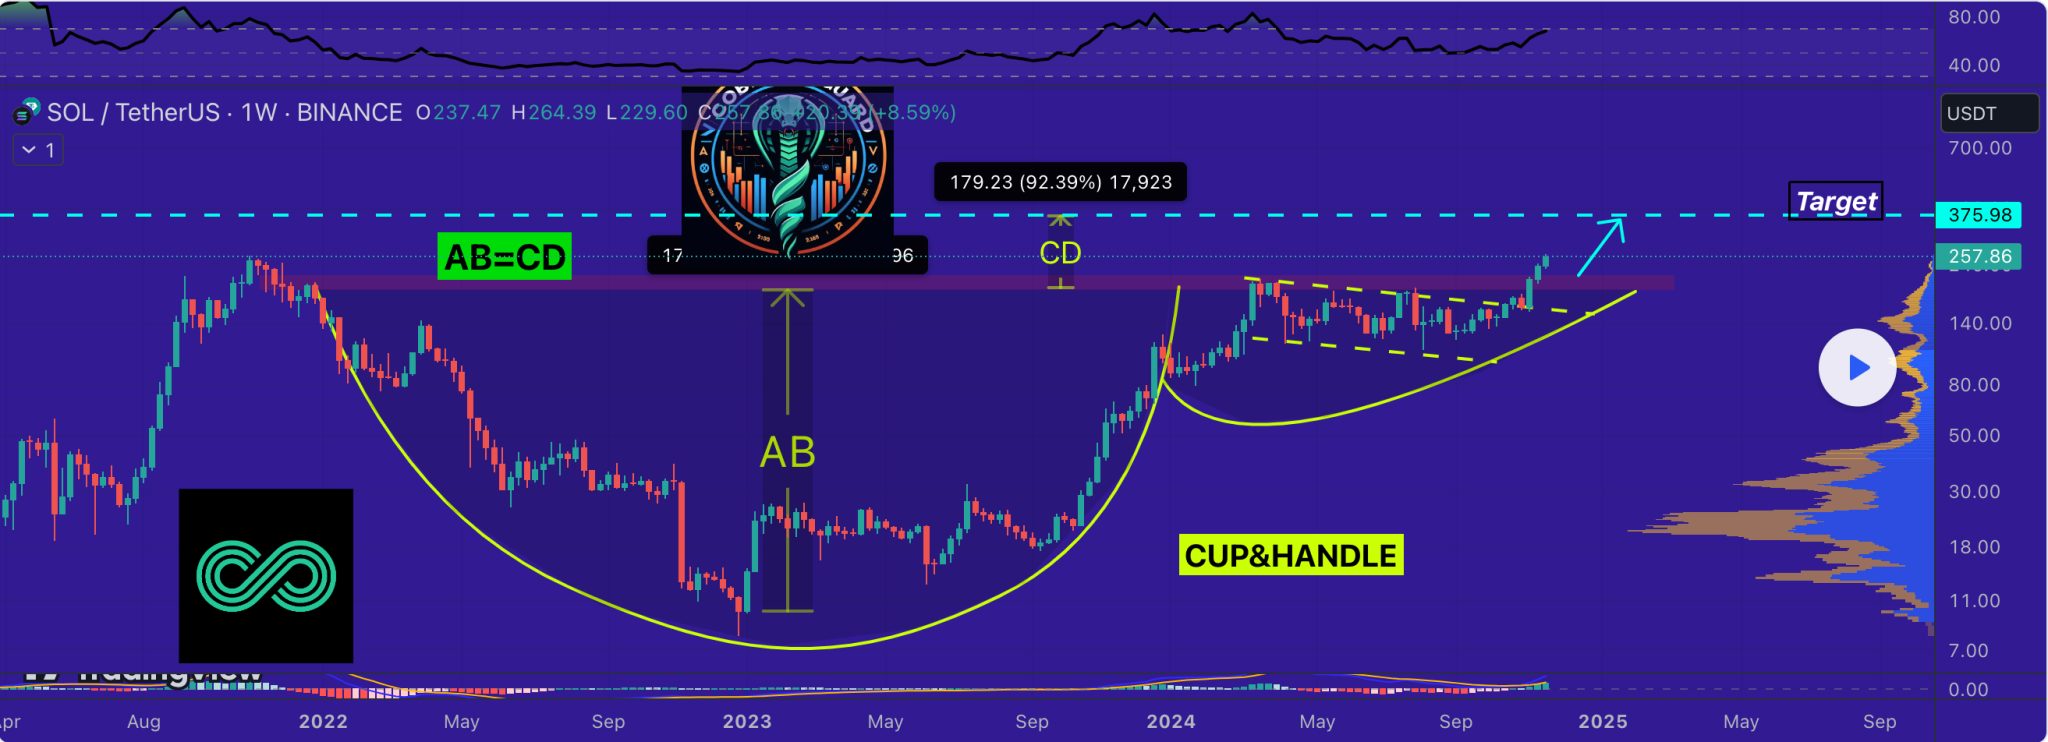
Chart analysis from TradingView reveals a “cup and handle” formation for Solana’s price action. This pattern, which typically signals a bullish continuation, emerged after prolonged accumulation.
The “cup” section of the pattern, visible between late 2022 and mid-2024, formed a rounded bottom, with the lowest point recorded near $7. The “handle” followed, forming a downward channel from March 2024 before the breakout occurred.

Further supporting the bullish outlook is an AB=CD harmonic pattern on the same chart, showing symmetry in price movements. The AB segment began with a dramatic 1797% increase, rising from $7 to $179.
Following the handle’s consolidation, the CD segment is projected to mirror this movement, targeting $375.98. This suggests a potential 92.39% surge from its current price. However, analysts warn that confirmation of this breakout will depend on a weekly candle close above key resistance levels.
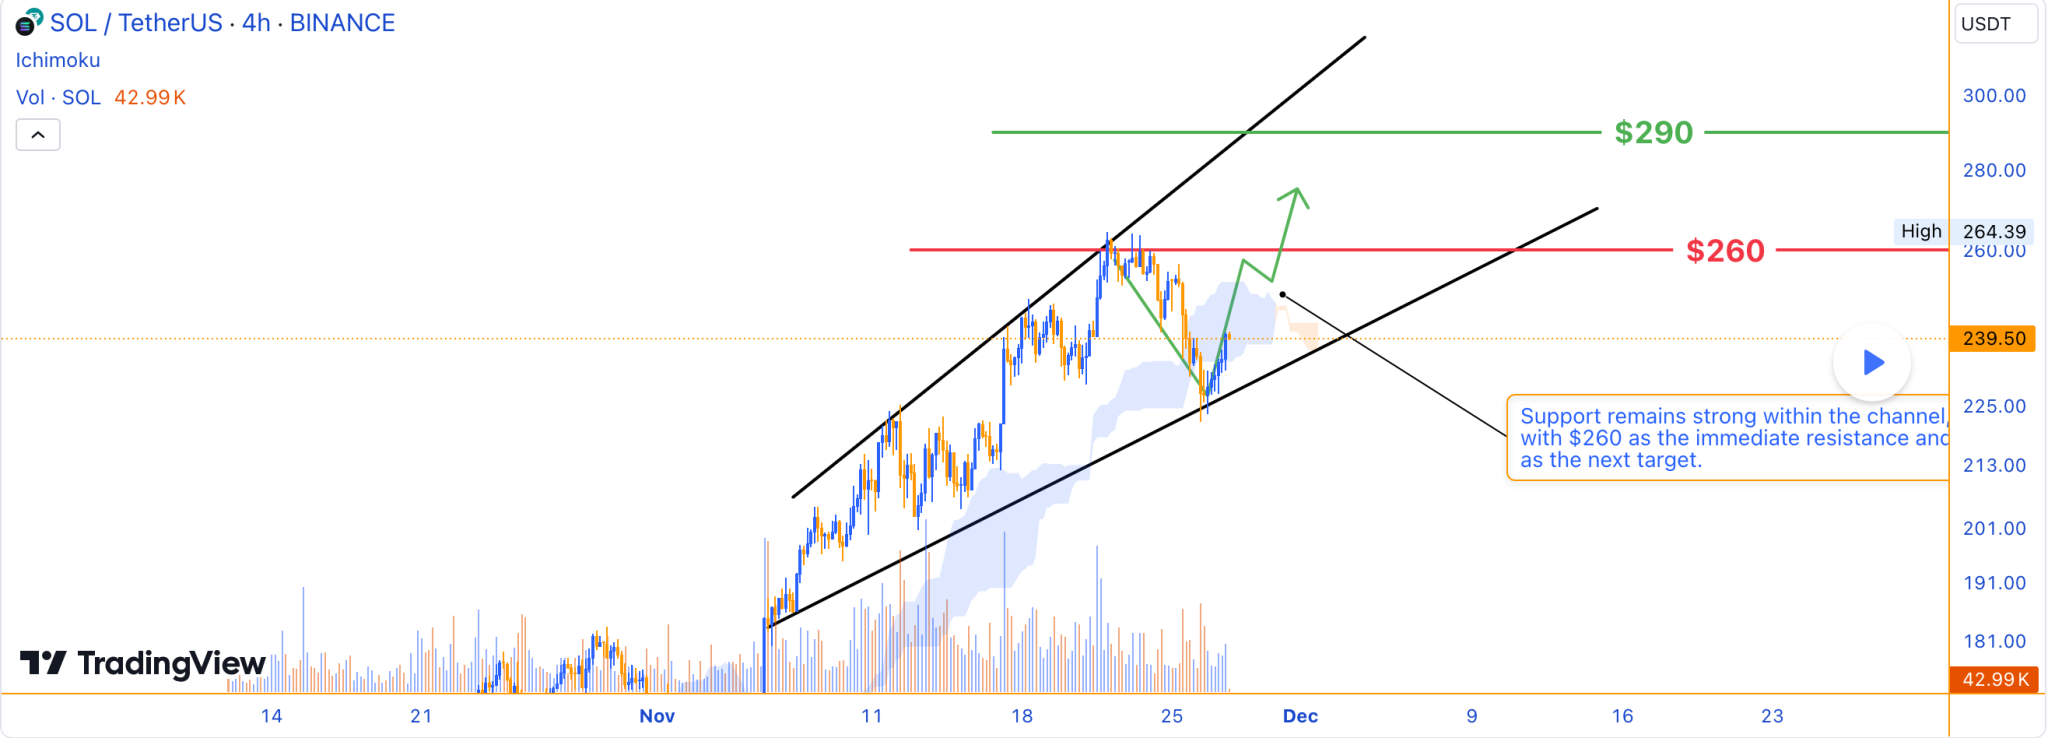
In another analysis on TradingView, Solana is seen trading within an ascending channel on the 4-hour timeframe, with a key resistance level at $260. A break above this resistance could push the price towards $290, the next significant target.
Alternatively, if Solana faces rejection at the $260 resistance, a temporary pullback within the ascending channel could affect short-term price action.

Rising TVL Reflects Strength
In addition to price action, Solana’s ecosystem continues to show signs of resilience, particularly in its Total Value Locked (TVL).
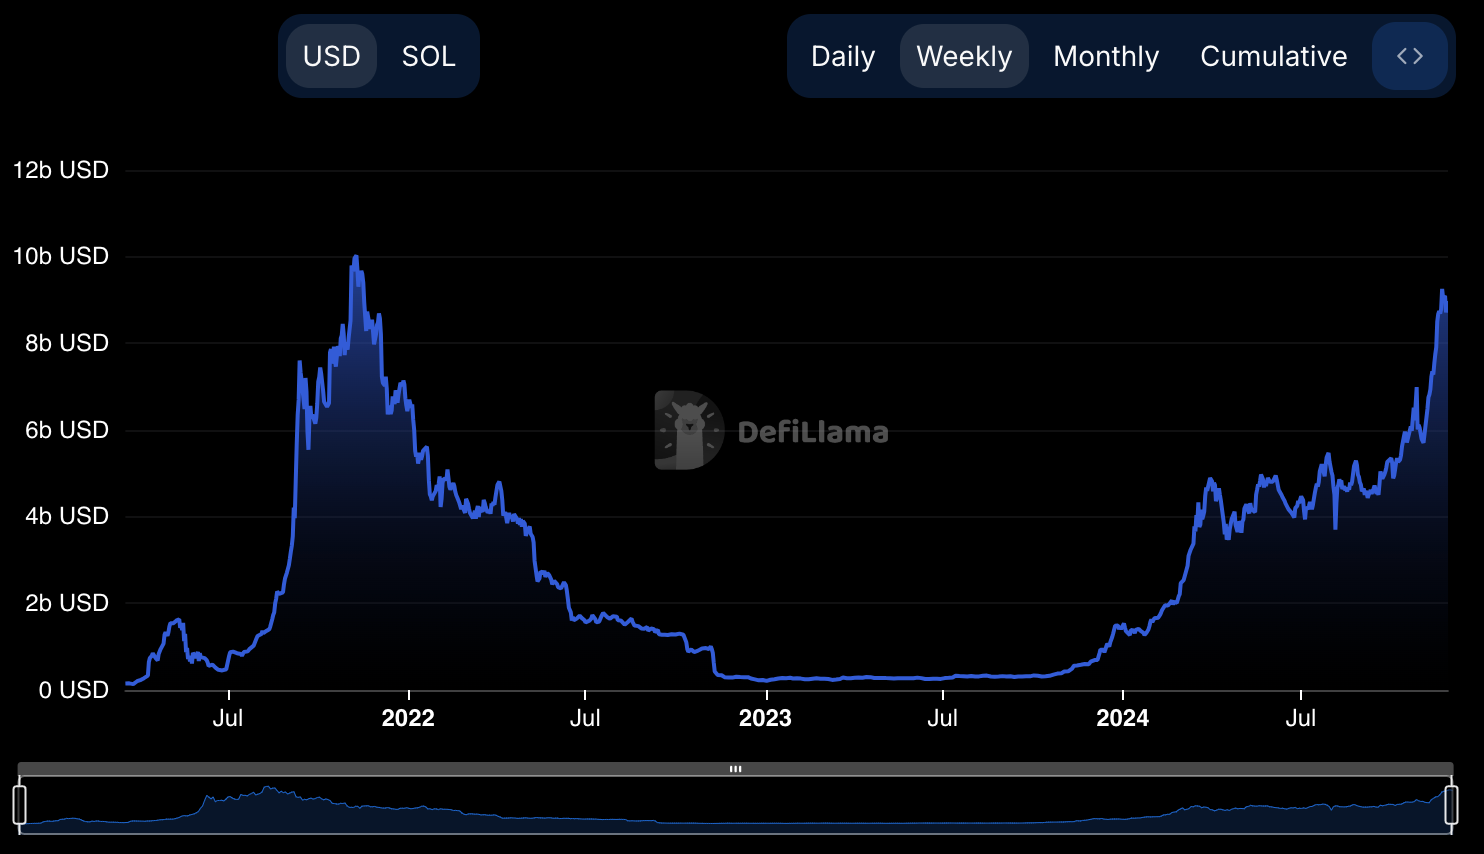
As of November 28, TVL rose to $8.97 billion over the past seven days, reflecting increased user activity and growing confidence in the platform.

While TVL remains below its historical high of around $10 billion, this recent growth signals further potential if favorable market conditions persist. Historically, increases in TVL have been strongly correlated with Solana’s price appreciation, further supporting the cryptocurrency’s bullish outlook.
 thecryptobasic.com