
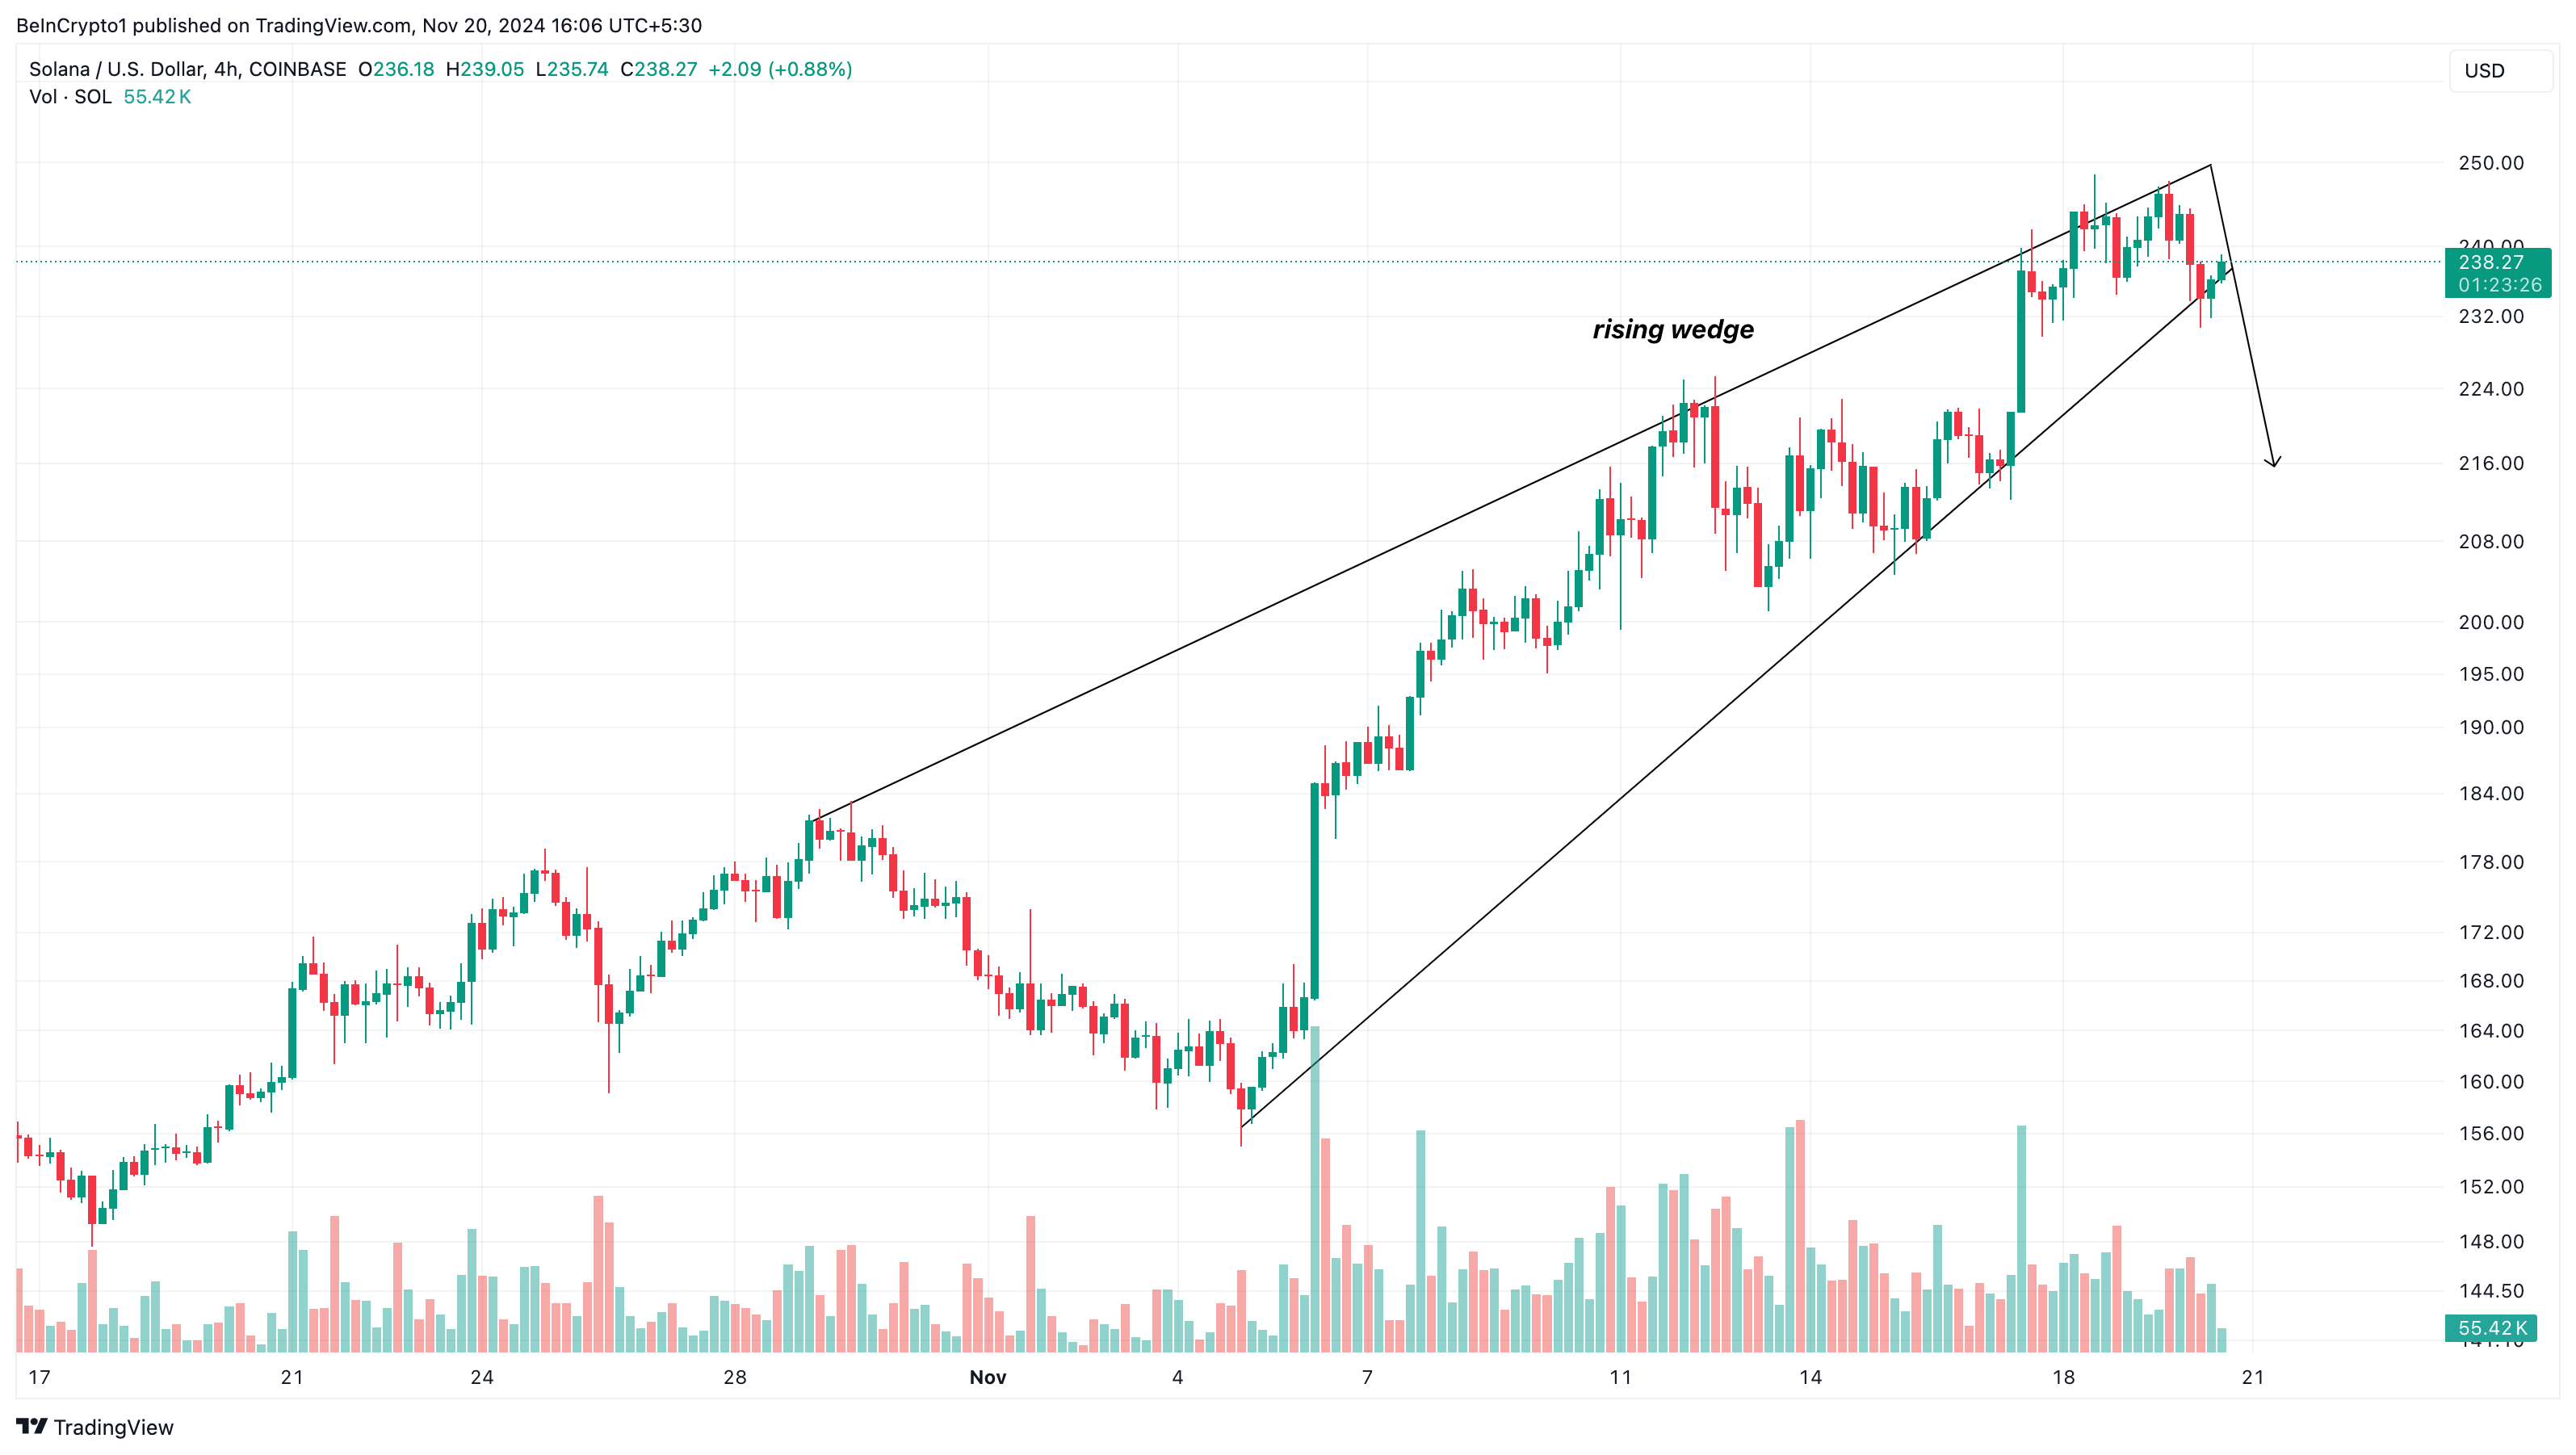
Solana’s ($SOL) price has formed a rising wedge on the 4-hour chart, suggesting that the altcoin’s value could face a setback before its potential rise toward $260. At press time, $SOL’s value is $237.88, representing a 15% hike in the last seven days.
While $SOL holders would expect the rally to continue, several technical indicators suggest that they might need to wait a little longer.
Solana Uptrend Pulls Back
On the 4-hour chart, BeInCrypto observed that a Solana rising wedge pattern has appeared. A rising wedge is a technical pattern commonly seen as a bearish signal, suggesting a potential reversal of an uptrend.
Two converging trendlines define the pattern. Here, the lower trendline (support) rises more steeply than the upper trendline (resistance), forming a narrowing channel. When the price breaks below the lower trendline, it confirms the bearish reversal, indicating a potential decline.
However, in some cases, a breakout to the upside can occur, though it is less common. In $SOL’s case, it appears that the price is on the cusp of breaking below the lower trendline. Once validated, this could halt the altcoin’s rally, and a notable downturn could be next.
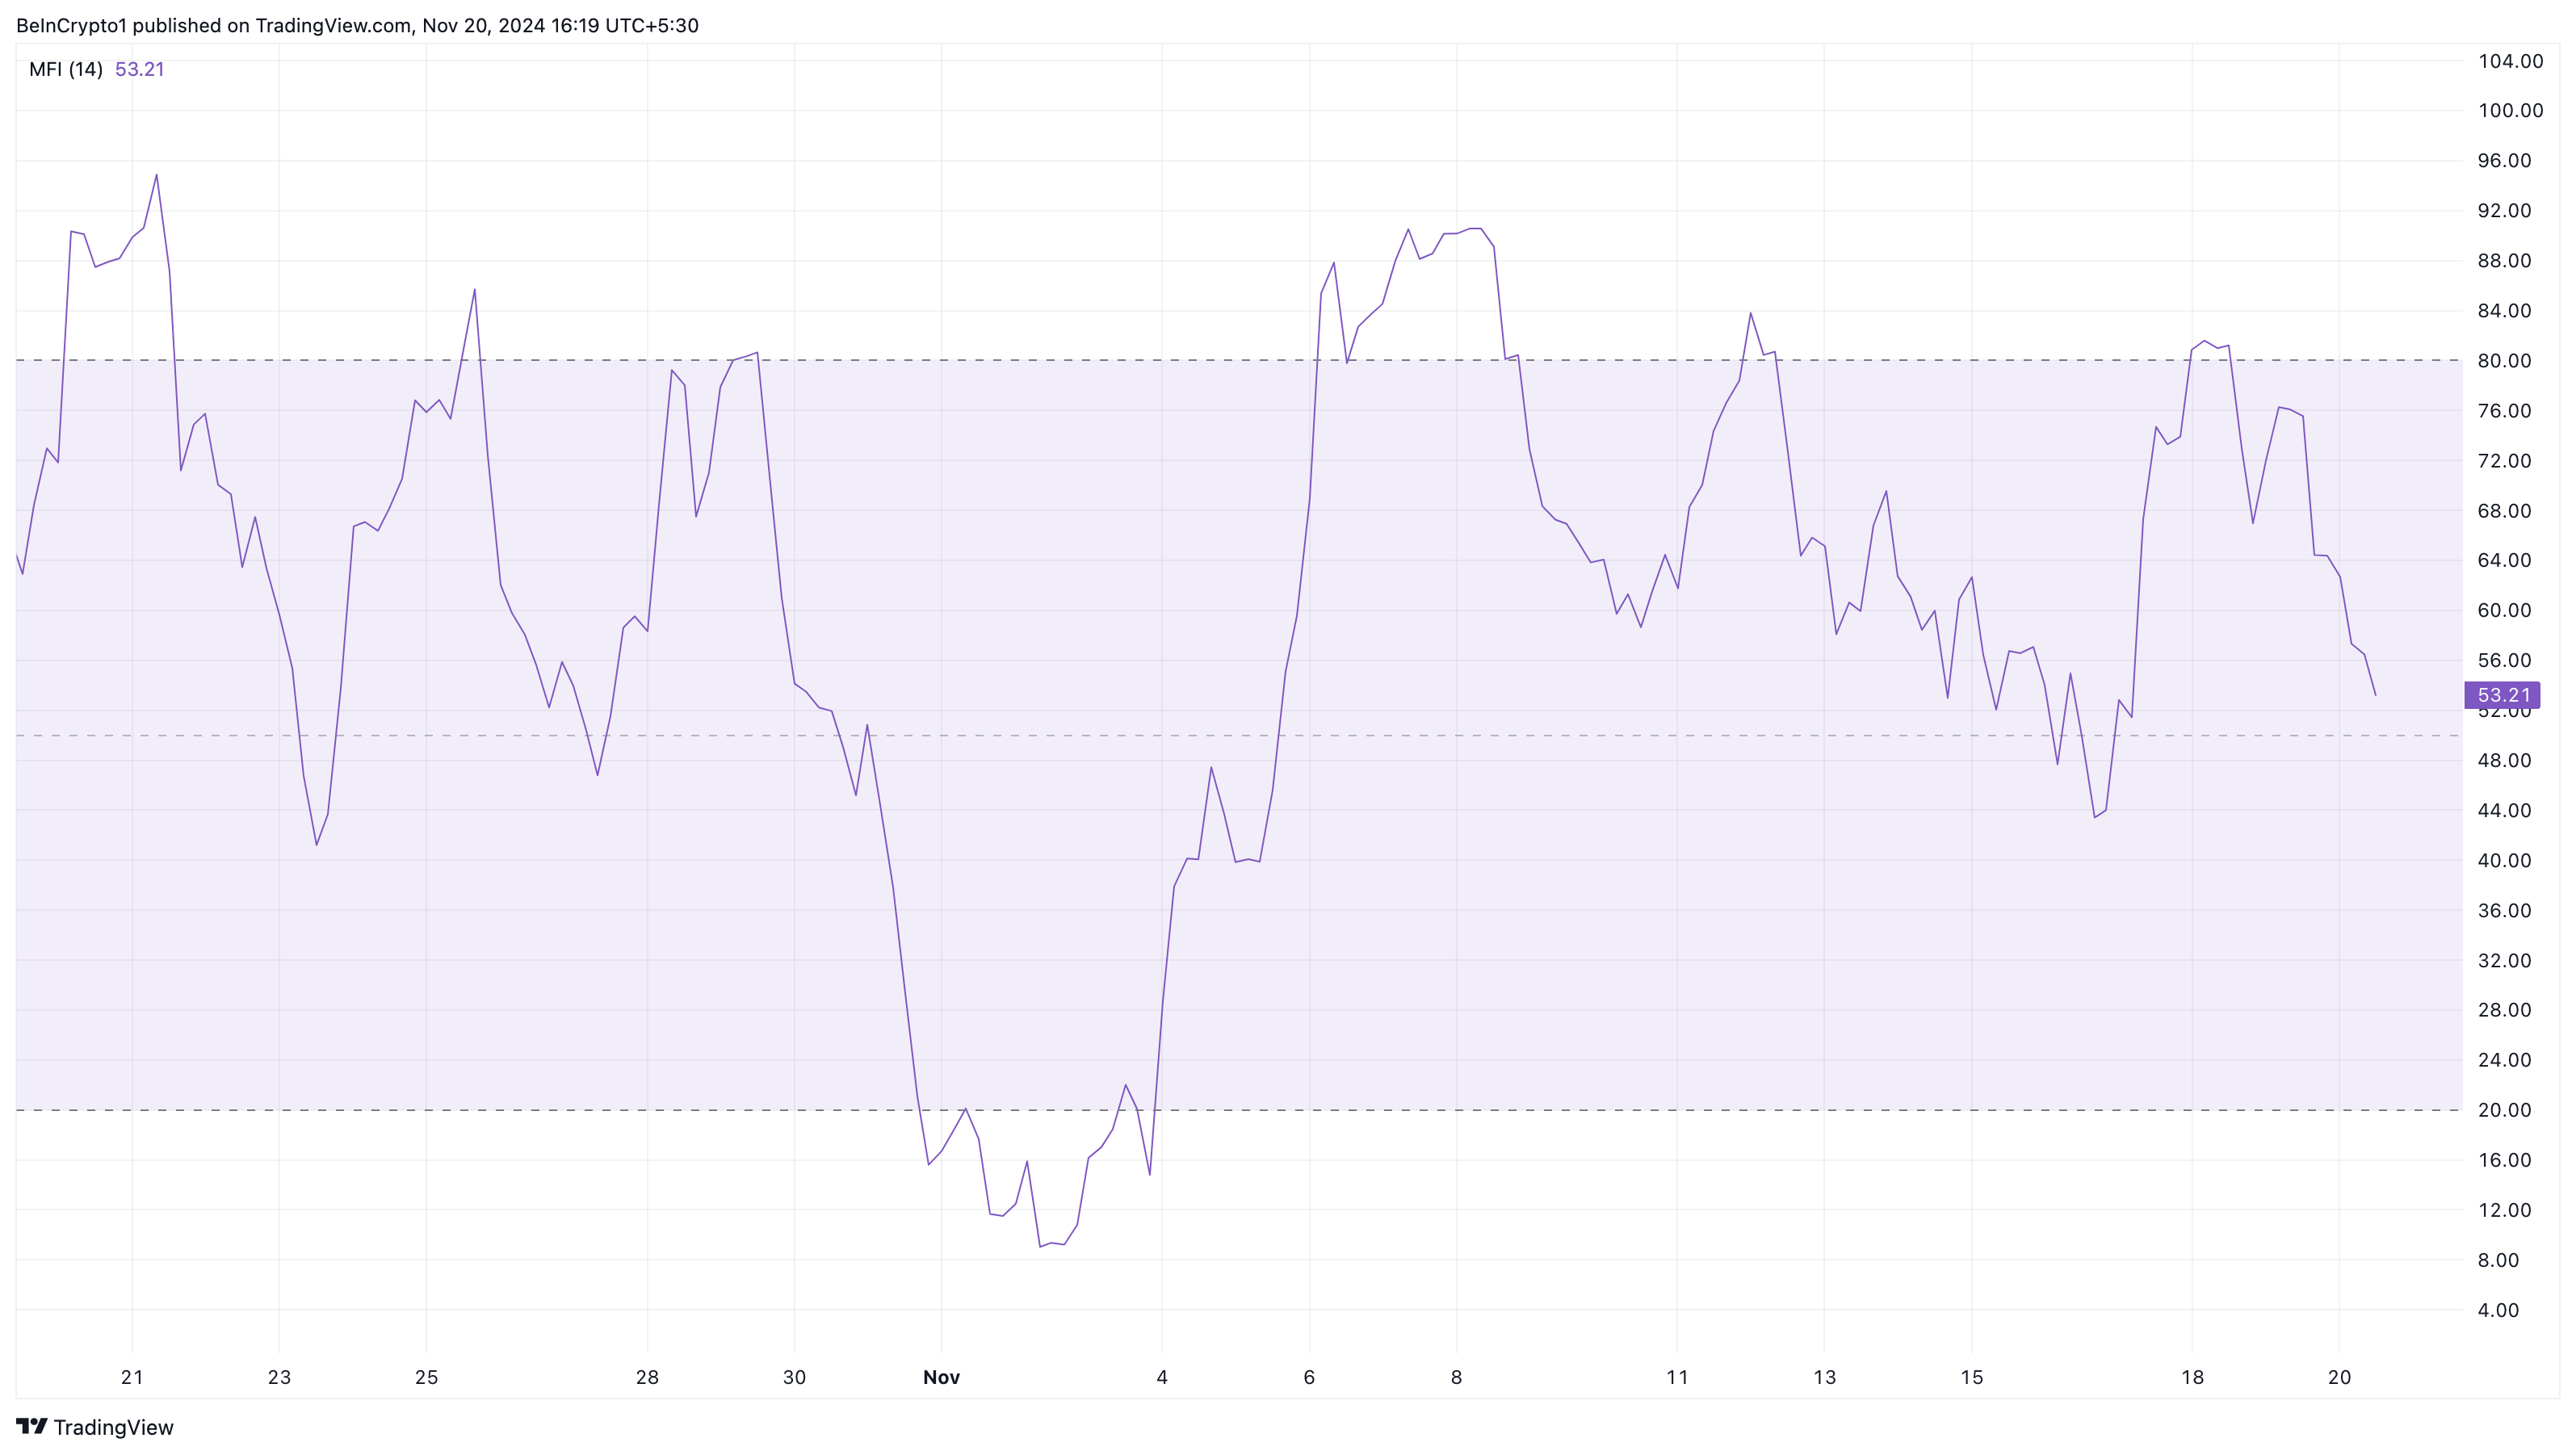
Furthermore, the Money Flow Index (MFI) adds weight to this bearish outlook. Notably, the MFI is a technical indicator that uses price and volume to measure the capital flowing in and out of a cryptocurrency.
A rising MFI indicates strong buying pressure, while a decline highlights sellers’ dominance. Currently, the MFI shows a downward trend, amplifying the bearish sentiment. When paired with the emerging rising wedge pattern, this confluence of signals reinforces the case for a potential decline in Solana’s price.
$SOL Price Prediction: $205 Before $260?
On the daily chart, Solana’s price faced resistance at $239.56 as it attempted to climb toward $260. Due to this development, $SOL might not find it easy to hit its all-time high in the short-term
The Fibonacci retracement indicator also supports this prediction. For context, the Fib indicator shows a sequence that generates a pattern of steadily increasing numbers that converge toward the price levels where a cryptocurrency might reach
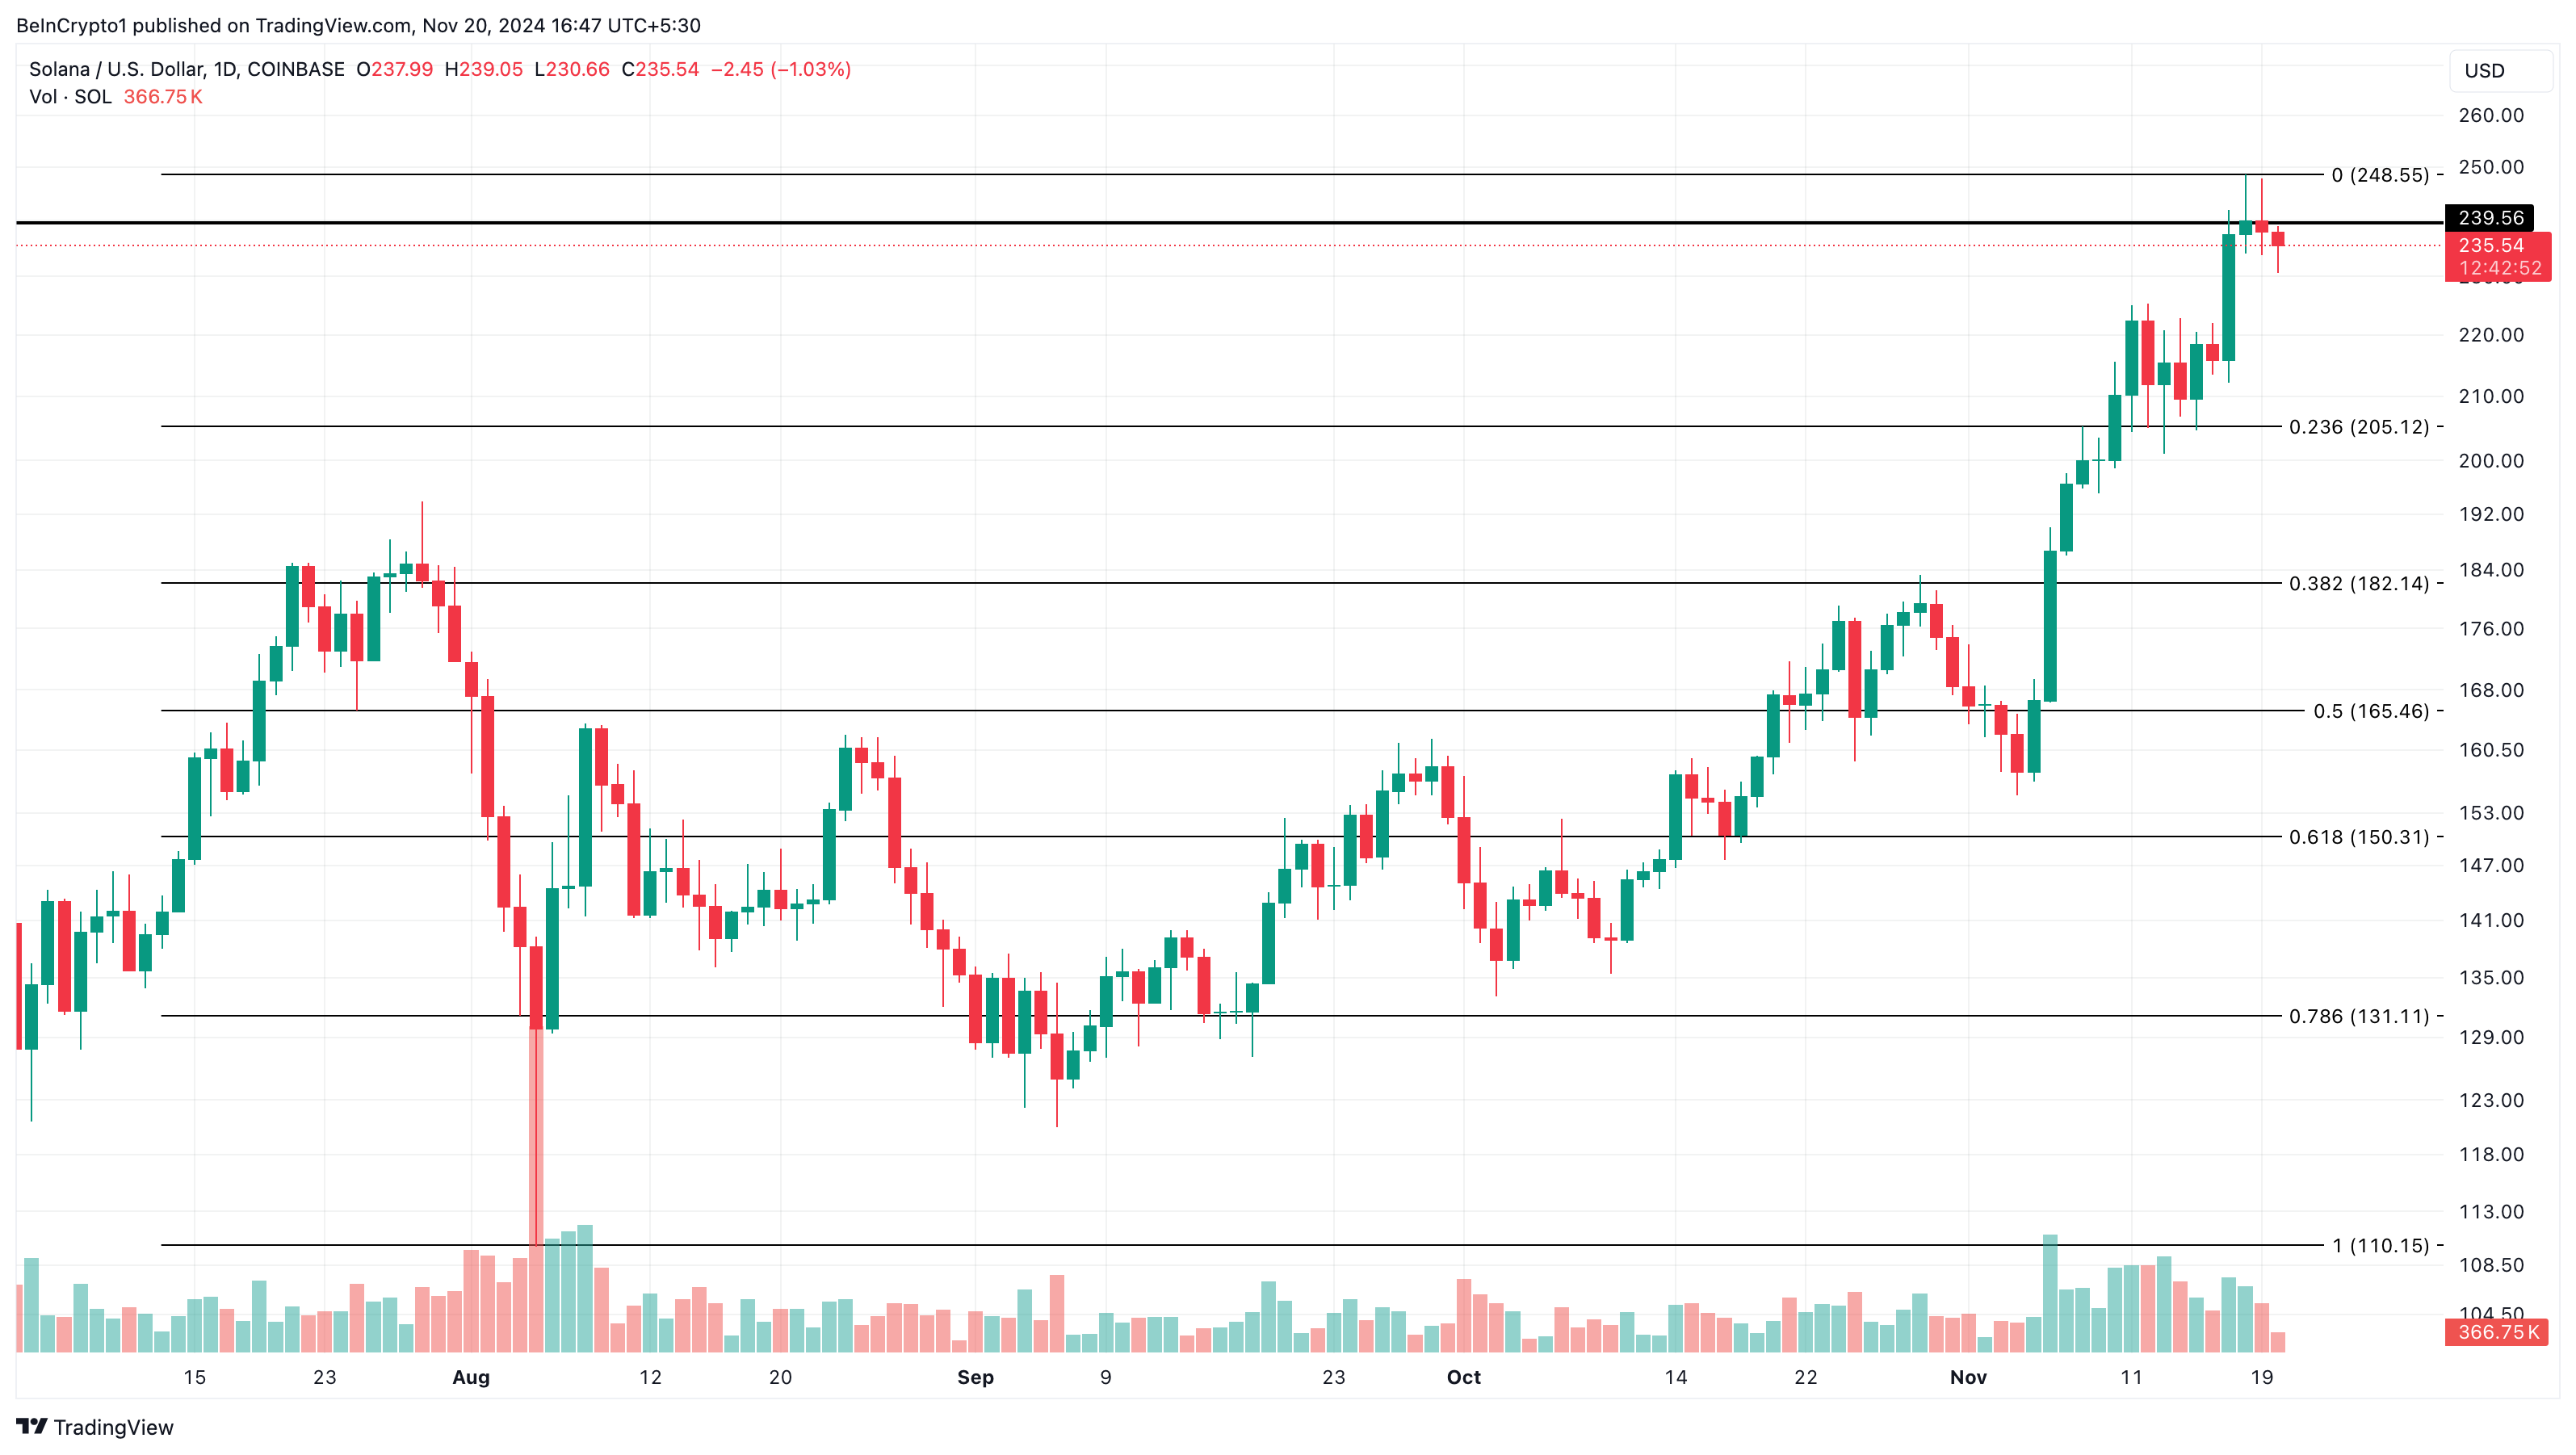
A key one is the 23.6% Fib level, which shows a potential pullback point. Considering the Solana rising wedge and lack of buying pressure, the altcoin’s price could decline to $205.12.
However, if $SOL breaks above the upper trendline of the rising wedge, this might not happen. Instead, the token could rise above $260 and hit a new all-time high.