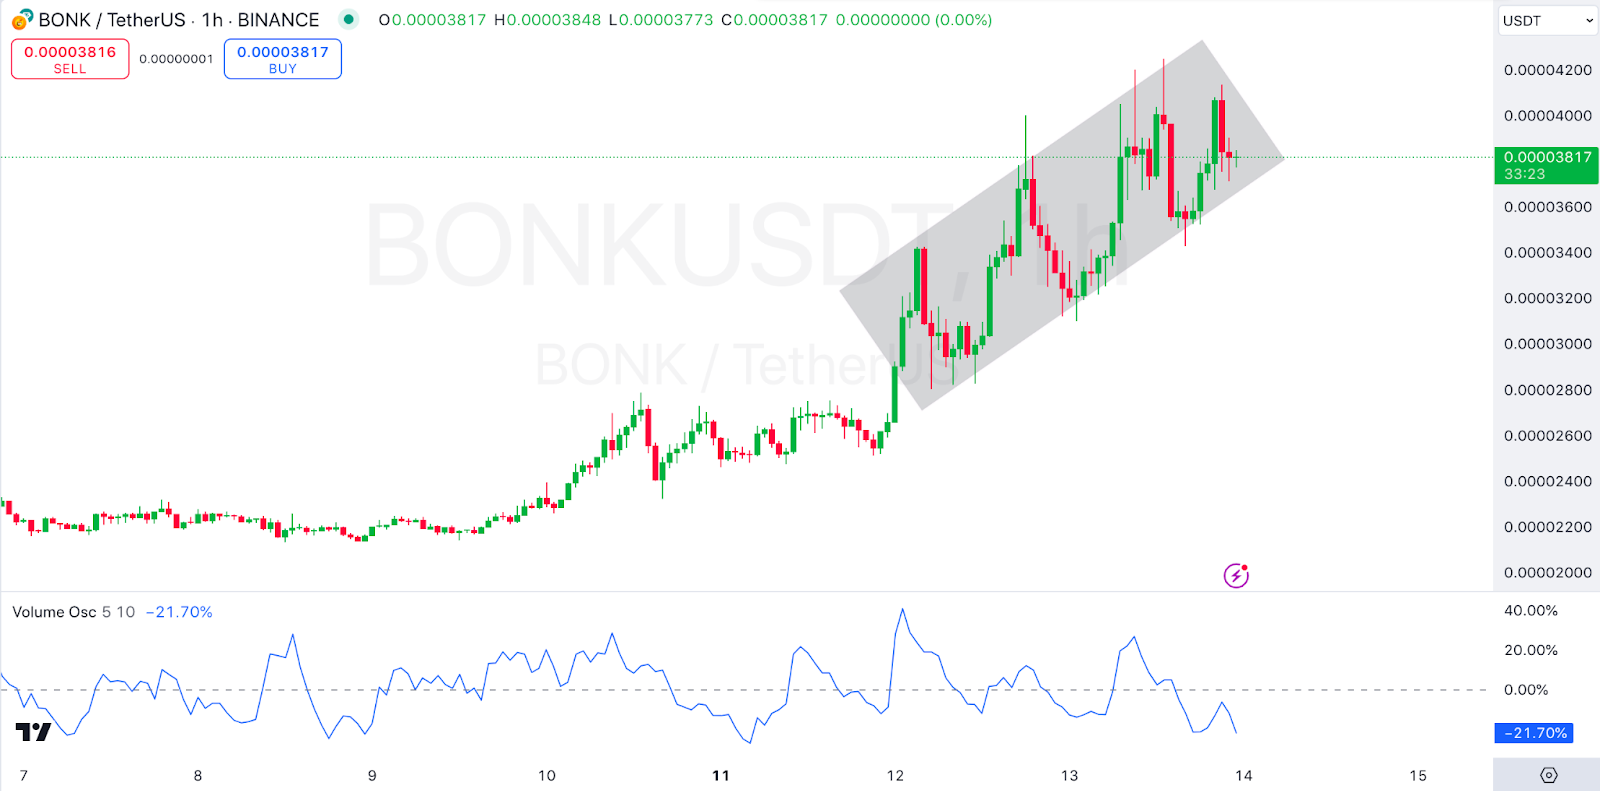
Based on current market dynamics, analysts predict a short-term correction will be next for Bonk. After a powerful rise within the previous day, Bonk jumped someplace over 10% within the subsequent 24 hours.
According to them, buying off the back of a +40% daily increase is risky, too, especially if a period of ‘chop’ or sideways movement is imminent. They warn that a pullback is likely not too far away.
Bonk Price Surge: How Far Will It Go?
Bonk has surged over 10% in the past 24 hours, lifting its market cap to about $2.87 billion. There is strong market interest and high activity around this asset, as measured by $2.49 billion in trading volume over the same period.
With its $3.54 billion Fully Diluted Valuation (FDV), the market seems positive despite the coin’s recent volatility. The analyst tweeted that $BONK is going much higher, but buying off of a +40% candle day is not recommended.
Examining Bonk Technical Indicators
Although the recent spike in Bonk’s price action has made many think that a short-term pullback is more likely, the technical analysis of Bonk’s price indicates that it is most likely.
Bonk shows a clear uptrend on the one-hour chart, with $BNK$ hitting new local highs. Nevertheless, the chart also shows some resistance zones that could temporarily hinder the upward trend of prices.
Two key support areas have been identified as green zones where a possible price correction could stabilize before another push higher.
These look like zones that traders may start buying in if the price should return to these levels soon.

Bonk’s volume oscillator shows declining buying pressure, suggesting that the current rally will blow until momentum dries up. This is a typical pattern for assets that experience sudden surges in price.
Future Outlook
The excitement and buying interest will soon wane, and prices will either cool off (consolidating sideways or even plunge slightly).
Prices may fight to break down through this resistance within Bonk’s current price channel, especially when they face resistance so close to the upper boundary.
This is where prices often catch themselves because they always encounter difficulties doing what needs to be done without having support buying involved.
Generally, strong bullish momentum rising from the channel’s upper boundary with a possible further rally could mean the price will break out above the channel’s upper boundary.
However, a trend reversal may even appear if the price drops below the channel. That is, the price might want to find support at a lower level.
If the price cannot break above the resistance level of the ascending channel, the diminishing volume might suggest that the price will head into consolidation or reversal before the chart can establish a short-term bullish trend.
 thecoinrepublic.com
