Tron (TRX) has reached a major milestone, with its market capitalization having surpassed $16 billion for the first time.
This spike in engagement is indicative of the increased intrigue in the project. Over the last week, TRX has seen impressive growth of more than 10%.
According to the latest data, TRX is currently trading at $0.1848, a price not seen for some time. TRX gained over 10% in the past seven days as its market cap went parabolic.
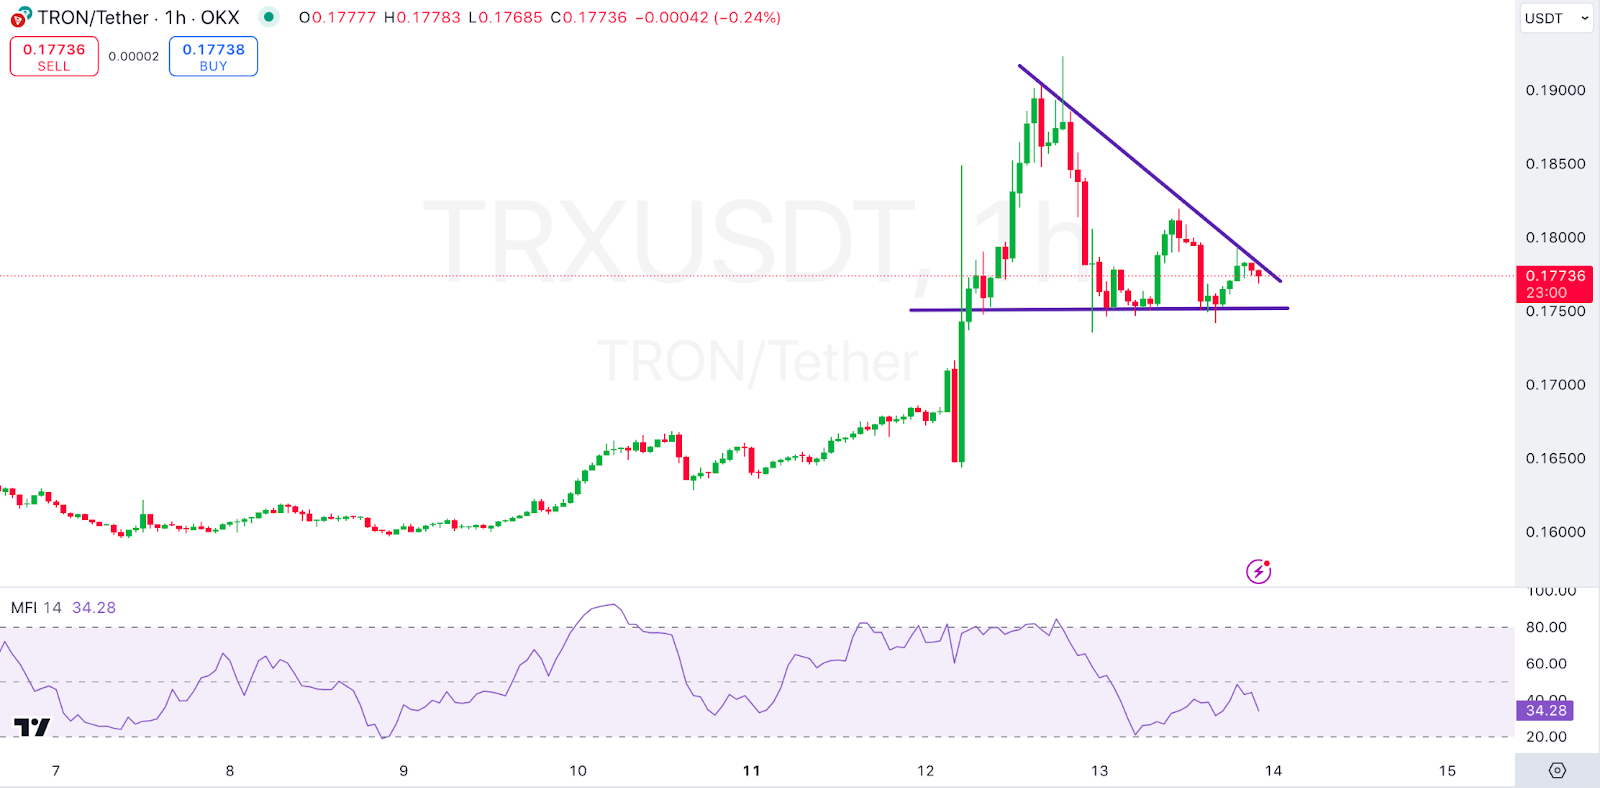
Tron’s recent price action illustrates a clear trend of TRX going from $0.1652 to peaking current trade at $0.1848.
This reinforces Tron’s upward momentum with positive market conditions. If the same trend continues, it also points out the possibility of further growth.
Tron Technical Analysis: Bullish Indicators Suggest Potential for Further Gains
TRX’s current trading status within a bullish pattern indicates that a further rise is likely. Looking at an in-depth analysis, Tron looks like it is in a consolidation phase, which is commonly regarded as healthy in either technical analysis.
As the price rallies, the tendency to consolidate at a high level indicates that traders are taking profits. Still, the demand pushing the rallies is enough to keep the price near its recent highs.
The descending trendline resistance is combined with a horizontal support line at the $0.177 level, making the classic triangle chart on the chart.
Depending on market power, this setup often results in a breakout, either to the upside or downside.
Future Outlook
With a recent bullish trend, an upward breakout could be much more likely if the buying pressure remains strong.

According to the Money Flow Index (MFI), which is calculated and currently reads 34.28, TRX is not overbought yet.
The low MFI score indicates this could move higher with still more upside to go before facing resistance.
Traders can see this as a positive factor as it shows TRX hasn’t yet hit an exhaustion point, and even some price growth is possible.
From a technical point of view, the rise of TRX trading volume during the past period and a bullish triangle pattern indicate that the short cycle TRX may take prices up.
If Tron can break the descending trendline resistance, more technical traders will begin taking buying positions, potentially pushing the price above the $0.19 level and into new local highs.
If TRX breaks below the horizontal support, it might signal a short-term retracement but would probably keep the bullish trend as the market’s sentiment is much more bullish than other markets.
 thecoinrepublic.com