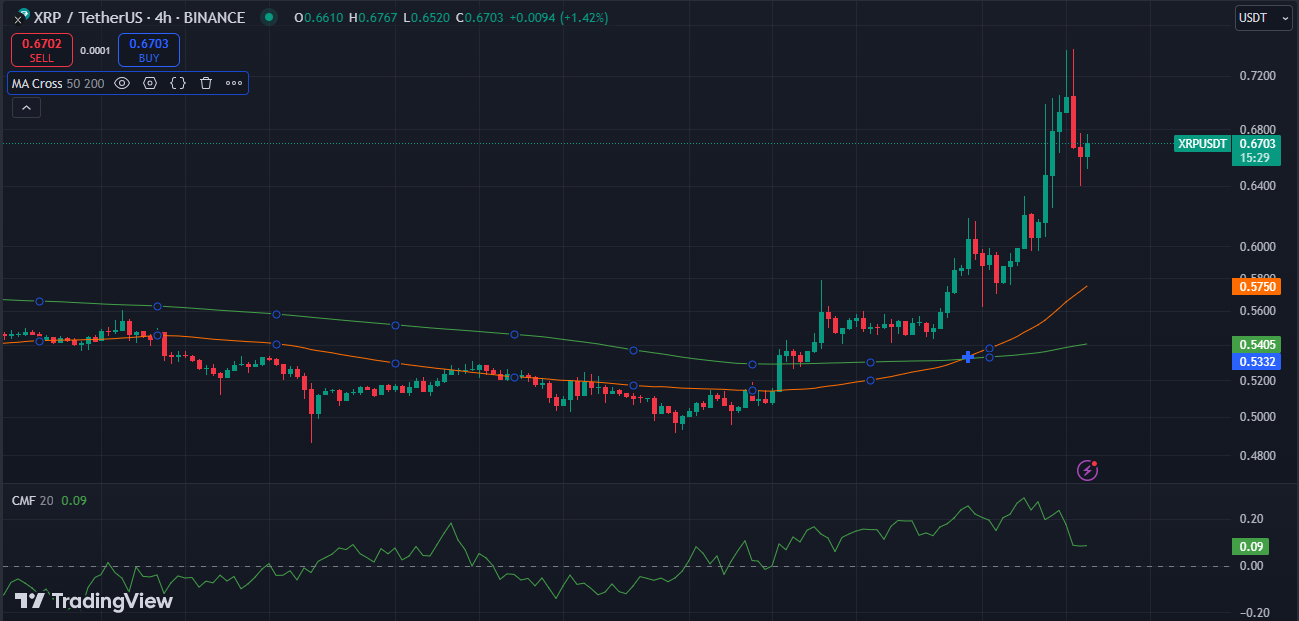
- XRP surged over 20%, breached the critical $0.70 resistance, and reached an intraday high of $0.7416.
- The surge brought XRP close to its yearly high of $0.7443, recorded in March, after a prolonged bearish trend.
In the ongoing bull run, Ripple (XRP) finally signals a positive trend as it breaks through the key resistance of $0.70 after a week of bearish pressure. Today, the altcoin surged over 20% in early Asian trading hours, climbing from a low of $0.6101 to an intraday high of $0.7416, just shy of its yearly high of $0.7443 set in March.
The current rally in XRP follows a prolonged eight-month downturn, but XRP still faces strong resistance around the $0.74 zone. In March, it struggled to hold above this level, and today, the coin once again retreated after briefly reaching the same threshold, dropping back to $0.6731.
However, there’s growing optimism in the XRP market, driven by the potential for regulatory changes in the US. The biggest push for XRP’s recent price jump could be the possibility of a more crypto-friendly U.S. government under Trump, who promised to fire SEC Chair Gary Gensler on his first day in office. This could potentially end the SEC’s years-long crackdown on cryptocurrencies.
Further, Ripple CEO Brad Garlinghouse has expressed hope that the ongoing SEC lawsuit could be resolved soon, especially with an upcoming pro-crypto administration. Following his open tweet, the crypto analysts and the community expect that XRP could hit $1 in the coming days. XRP’s technicals paint a bullish picture as well.
Golden Cross Signals Strong Upward Trend for XRP
On Nov. 5, XRP’s price at $0.5076 played a crucial role in triggering buying pressure as the election loomed. Following that, the altcoin entered bullish momentum slowly, and its RSI now stands at 68.52. As per the XRP/USDT pair on the 4-hour trading chart, it’s trading close to the overbought zone, indicating strong buying interest in the current market. This also hints at a potential slowdown or consolidation if the RSI crosses into overbought levels.

Further, XRP trades above the 50-day and 200-day MA, signaling a strong upward trend. Even on Nov. 10, the 50-day MA crossed above the 200-day MA and formed a Golden Cross—a classic bullish sign. Since then, the altcoin has climbed over 39%, from a low of $0.5332 to $0.7416.
On the other hand, a CMF of 0.07 shows modest buying pressure, indicating a neutral to slightly bullish sentiment. To validate this, after reaching an intraday high, XRP backed down to yesterday’s level.
At the time of writing, XRP is priced at $0.6752 with a market cap of $37.81 billion. Ripple’s native crypto is still well-positioned above the crucial resistance level of $0.65, a level that has been challenging to break for an extended period.
Additionally, its daily trading volume has climbed over 50%, reaching $10.26 billion. Based on the technicals, XRP is expected to trade between $1.0927 and $0.6105 in the upcoming days.
 thenewscrypto.com