Pepe (PEPE/USDT) price saw a bullish signal in that the price has been on the rise and crossed key resistance levels relative to the daily charts and wave analysis.
After recent breaks above the upper Bollinger Band and key Fibonacci retracement levels, charts point towards higher prices due to overbought conditions.
A breakout above the next resistance can support a continuation of the higher bull run as per Elliott Wave theory with wave 3 in progress
Pepe Price Surge and Overbought Indicators on Daily Chart
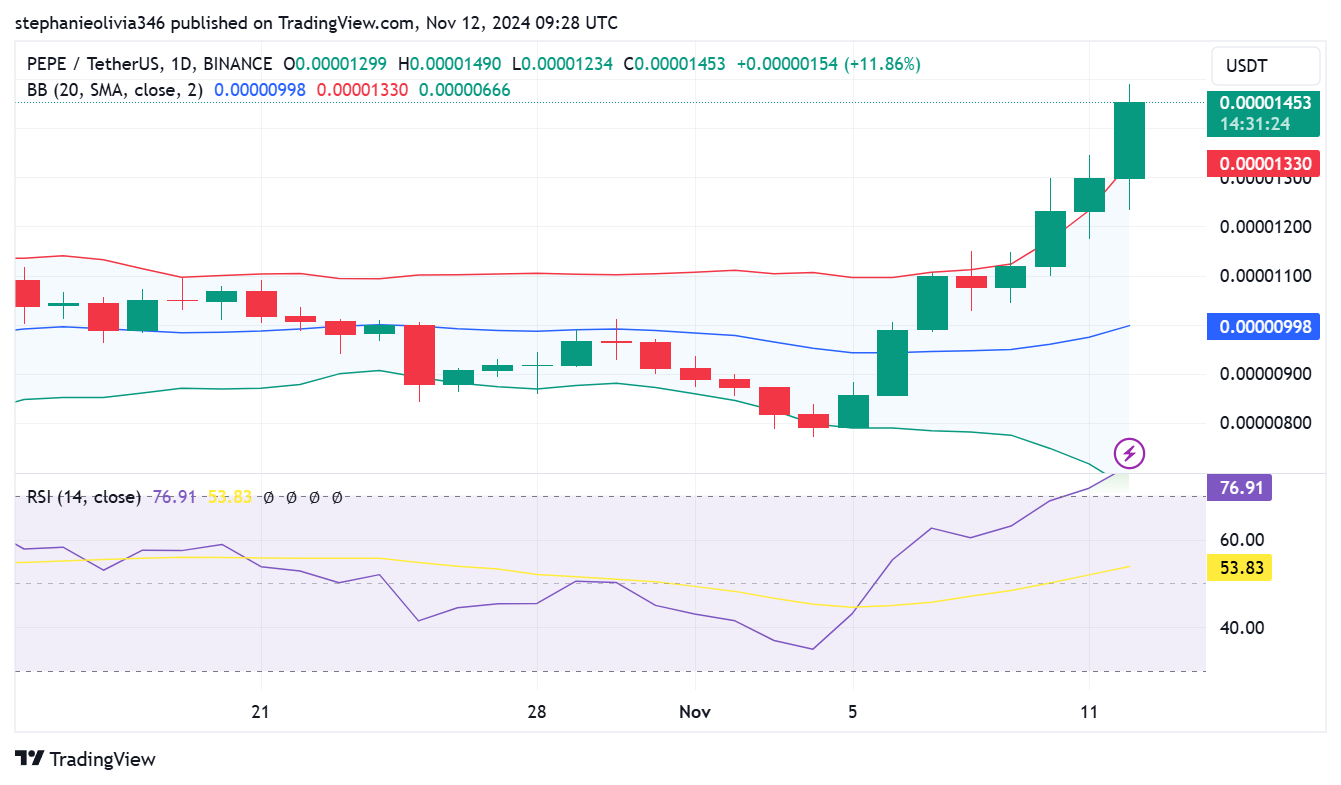
The recent price movement of Pepe depicts a steep upward momentum and has spiked above the upper Bollinger Band currently at $0.00001330.

However, trading above this band often points to increased bullish strength but can also reflect short-term overbought conditions as the asset is overbought.
As we know, once the price goes above the upper Bollinger Band it may undergo a consolidation or a stage of pulling back since the traders would start taking profits from the position.
The Bollinger Bands are widening, which may mean higher fluctuations and, therefore, developing a new trend. So long as Pepe stays above the middle Bollinger Band support at $0.00000998, this could continue moving up.
The RSI reading of 76.91 will signal that the conditions are now overbought meaning that a pullback or some period of consolidation is likely to occur. RSI above the 70 mark normally indicates overbought levels.
Bullish Elliott Wave Structure
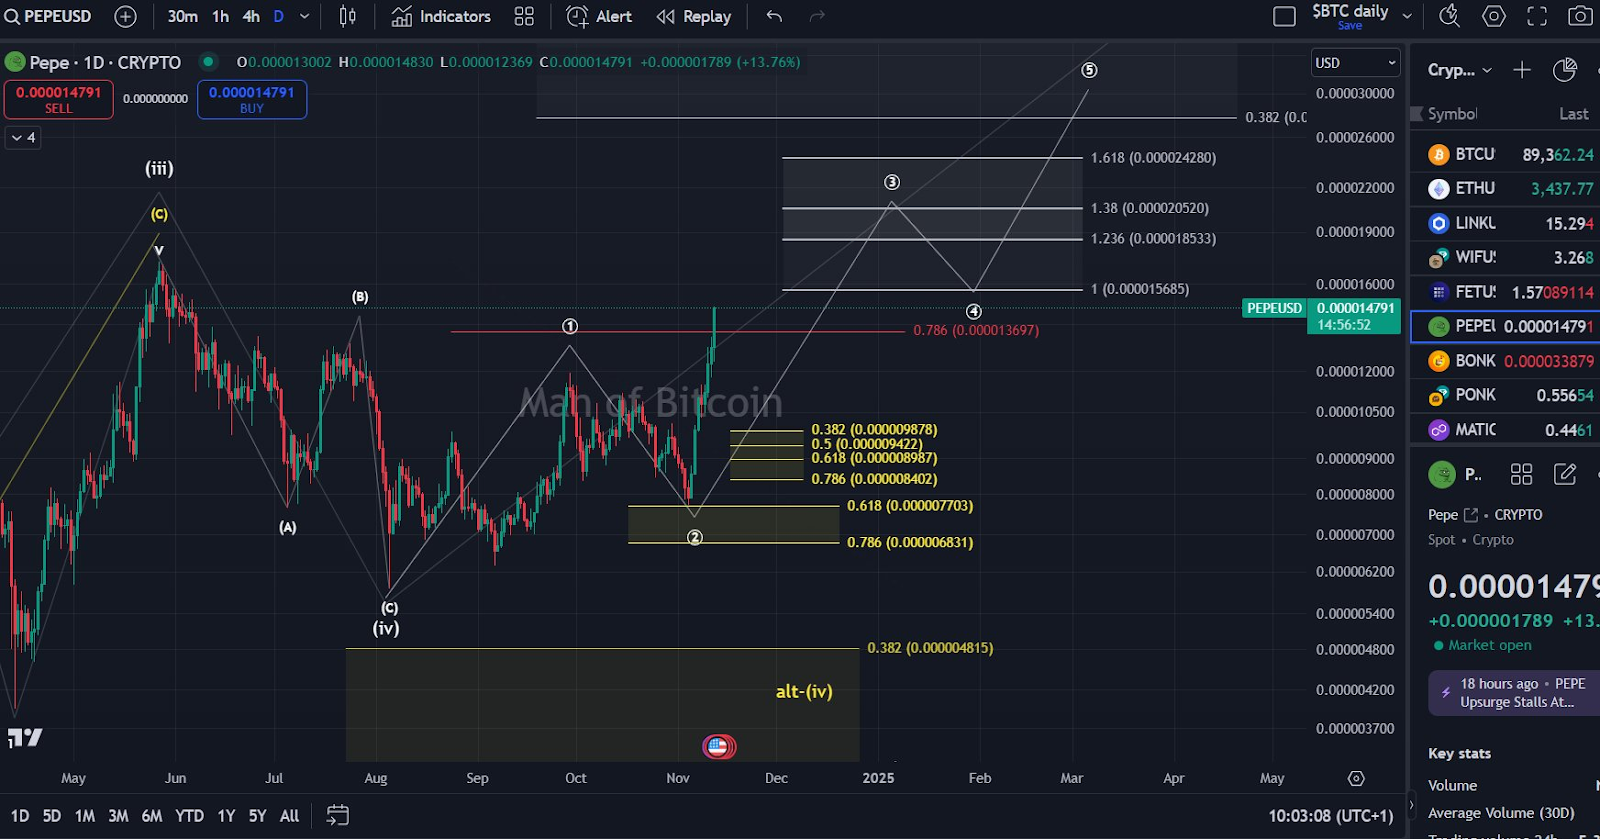
Cryptocurrency analyst Manofbitcoin further claimed that an increase above the 78.6% Fibonacci retracement level at $0.000013697 points to the continuation of wave 3 in an Elliott Wave pattern.
This level, which was strong resistance before, has been breached showing the price is now under buying pressure and in the early stage of wave 3, which is characterized by higher price gains.

According to Manofbitcoin, a move above $0.0000172 will signal the beginning of wave 3, which should attract more bullish trader attention. Wave 3 in Elliott Wave theory is typically one of the strongest waves in a five-wave sequence, which if Pepe can hold or build on current levels, there is potential for further upside.
Thus, in the case of wave 3’s continuation, the Fibonacci extension levels aim for maybe $0.000015685, $0.000018533, and the long-term level of $0.000024280.
Key Levels and Resistance Targets
Manofbitcoin’s analysis provides potential price targets based on Fibonacci extensions, key in projecting the likely end points of wave 3. The 1.0 extension level at $0.000015685 offers an initial upside target, while the 1.618 extension at $0.000024280 could mark the peak of a strong bullish move.
If Pepe successfully clears $0.0000172, it may attract further buying interest, setting the stage for these ambitious targets. These extension levels act as potential resistance points where profit-taking could occur.
Traders should monitor Pepe’s price closely as it approaches these levels, particularly if volume and momentum continue to support the trend.
An extended wave 3 move may lead to even further gains, but signs of weakening volume or momentum could suggest a reversal or period of consolidation.
 thecoinrepublic.com