
$PEPE rally has come to an abrupt halt, as the price faces rejection at resistance and begins its descent toward the key support level of $0.00001152. After a strong upward push, the token has encountered significant selling pressure, raising concerns about the sustainability of its bullish strength. Now, all eyes are on the $0.00001152 mark to determine if it can support a rebound or if this is the beginning of a deeper pullback.
This article aims to navigate $PEPE‘s recent price action as it encounters resistance, causing the rally to stall and the price to fall toward the crucial support level of $0.00001152. Through technical analysis, this piece assesses whether $0.00001152 will serve as a reliable support zone for a potential recovery or if the bearish pressure will push $PEPE further downward.
Resistance Strikes: What Halted Momentum Of $PEPE?
Recently, $PEPE’s price has turned bearish on the 4-hour chart, pulling back towards the $0.00001152 mark and the 100-day Simple Moving Average (SMA) after facing significant resistance at $0.00001313. This retracement signals growing bearish pressure, which could trigger a deeper correction for the cryptocurrency.
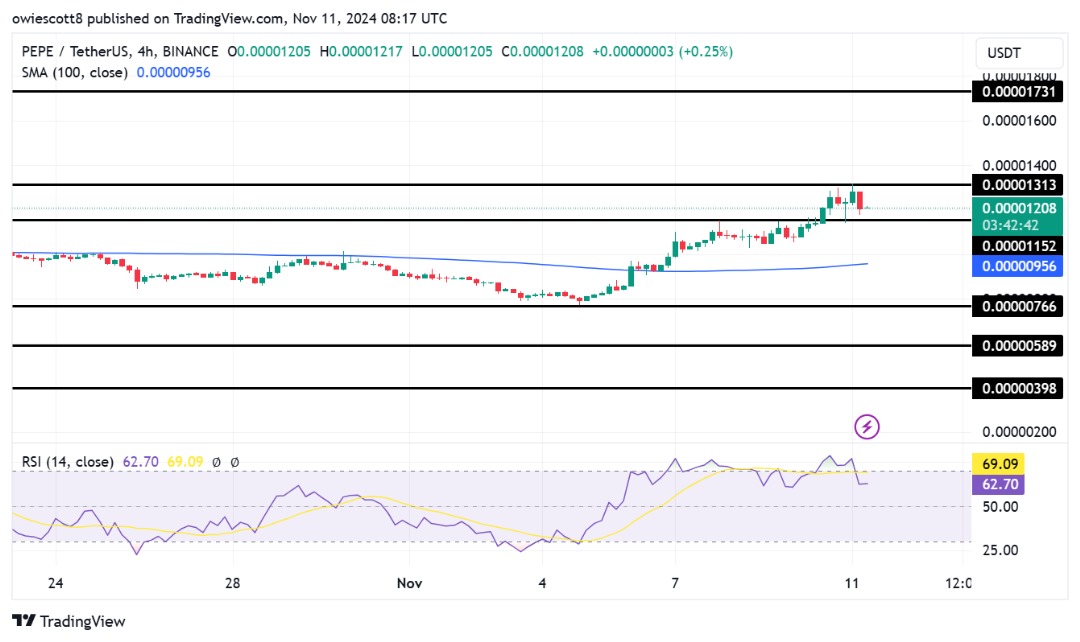
The 4-hour Relative Strength Index (RSI) shows a decline from 77% to 60%, indicating a weakening of upbeat momentum. As the RSI moves closer to neutral, buying pressure has subsided, and the market’s confidence in the uptrend is fading. Specifically, this shift suggests that $PEPE may be entering a correction phase, with the potential for further downward movement if the trend continues.
Although $PEPE is trading above the 100-day SMA, the daily chart shows increasing negative sentiment with bearish candlesticks and a decline toward $0.00001152, reflecting rising selling pressure as the meme coin struggles to hold higher levels. If bulls don’t defend the current support, additional declines are possible, making the 100-day SMA critical to watch for a reversal or continued correctional movement.
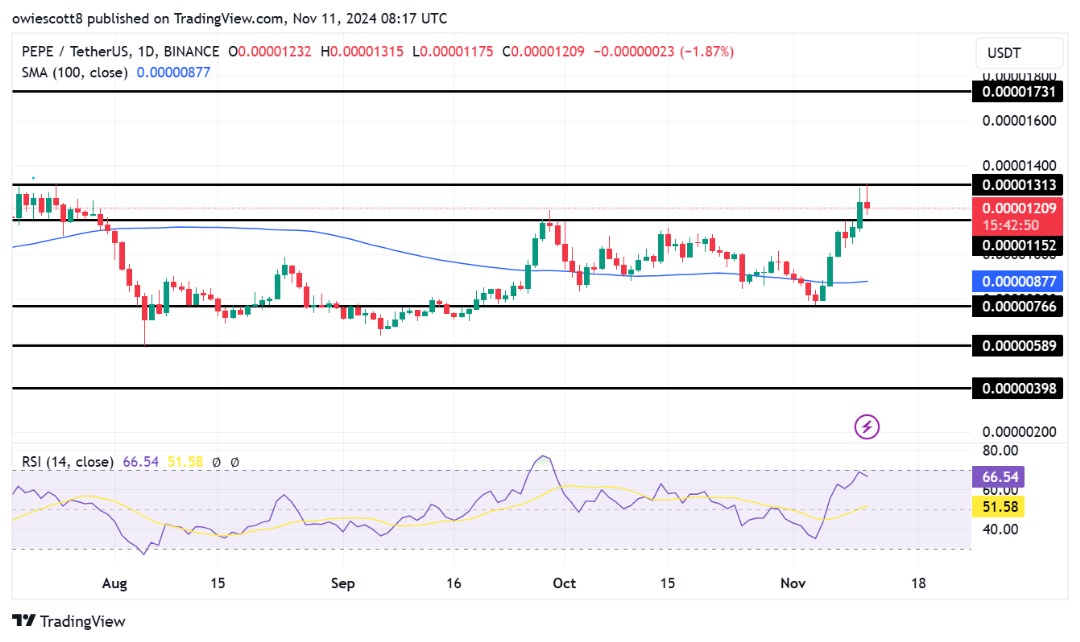
Finally, on the 1-day chart, the RSI is declining from its peak of 69%, indicating a potential shift in momentum. As the RSI nears the overbought threshold of 70%, this shows that buying pressure is easing, and the recent uptrend may be losing strength. The drop could signal a pullback or consolidation, with $PEPE possibly entering a correction phase before attempting to regain upside pressure.
Can The $0.00001152 Level Hold As Support?
The market is testing its strength as $PEPE’s price approaches the key support level of $0.00001152. This level has become crucial in determining whether the current bearish momentum will continue or if the price can stabilize. Should $0.00001152 hold, it may provide a foundation for a possible rebound, allowing bulls to regain control and resume the upside trend.
However, a breakdown below this level could signal additional declines, which could push the price toward the $0.00000766 support range and other lower levels.