Cardano’s $ADA price rallied by over 35% to a multi-month high of $0.63. This surge occurred after Charles Hoskinson announced plans to influence US crypto policy under the Donald Trump administration.
$ADA briefly traded above the $0.60 mark, marking the first time this had happened since April. However, while the market’s enthusiasm is evident, Cardano’s $ADA price rally may struggle to continue. This analysis delves into why.
Cardano’s Charles Hoskinson is Fueling the Current Rally
Cardano’s price has risen to a seven-month high. During Sunday’s trading session, the altcoin rallied by over 30%, outperforming Bitcoin and other leading crypto assets. This price surge was fueled by Charles Hoskinson’s declaration that he could be part of the Trump administration in 2025.
In a November 9 X podcast, Cardano founder Charles Hoskinson announced his commitment to supporting US crypto policy initiatives under the Trump administration.
“I’m going to be spending quite a bit of time working with lawmakers in Washington DC to help foster and facilitate with other key leaders in the industry with the crypto policy,” Hoskinson noted.
Cardano’s Market Overheats
Cardano currently trades at $0.56, an 11% decline from the $0.63 multi-month peak. Although buying activity is still underway, the Cardano market appears overheated, and the coin’s price may soon experience a pullback.
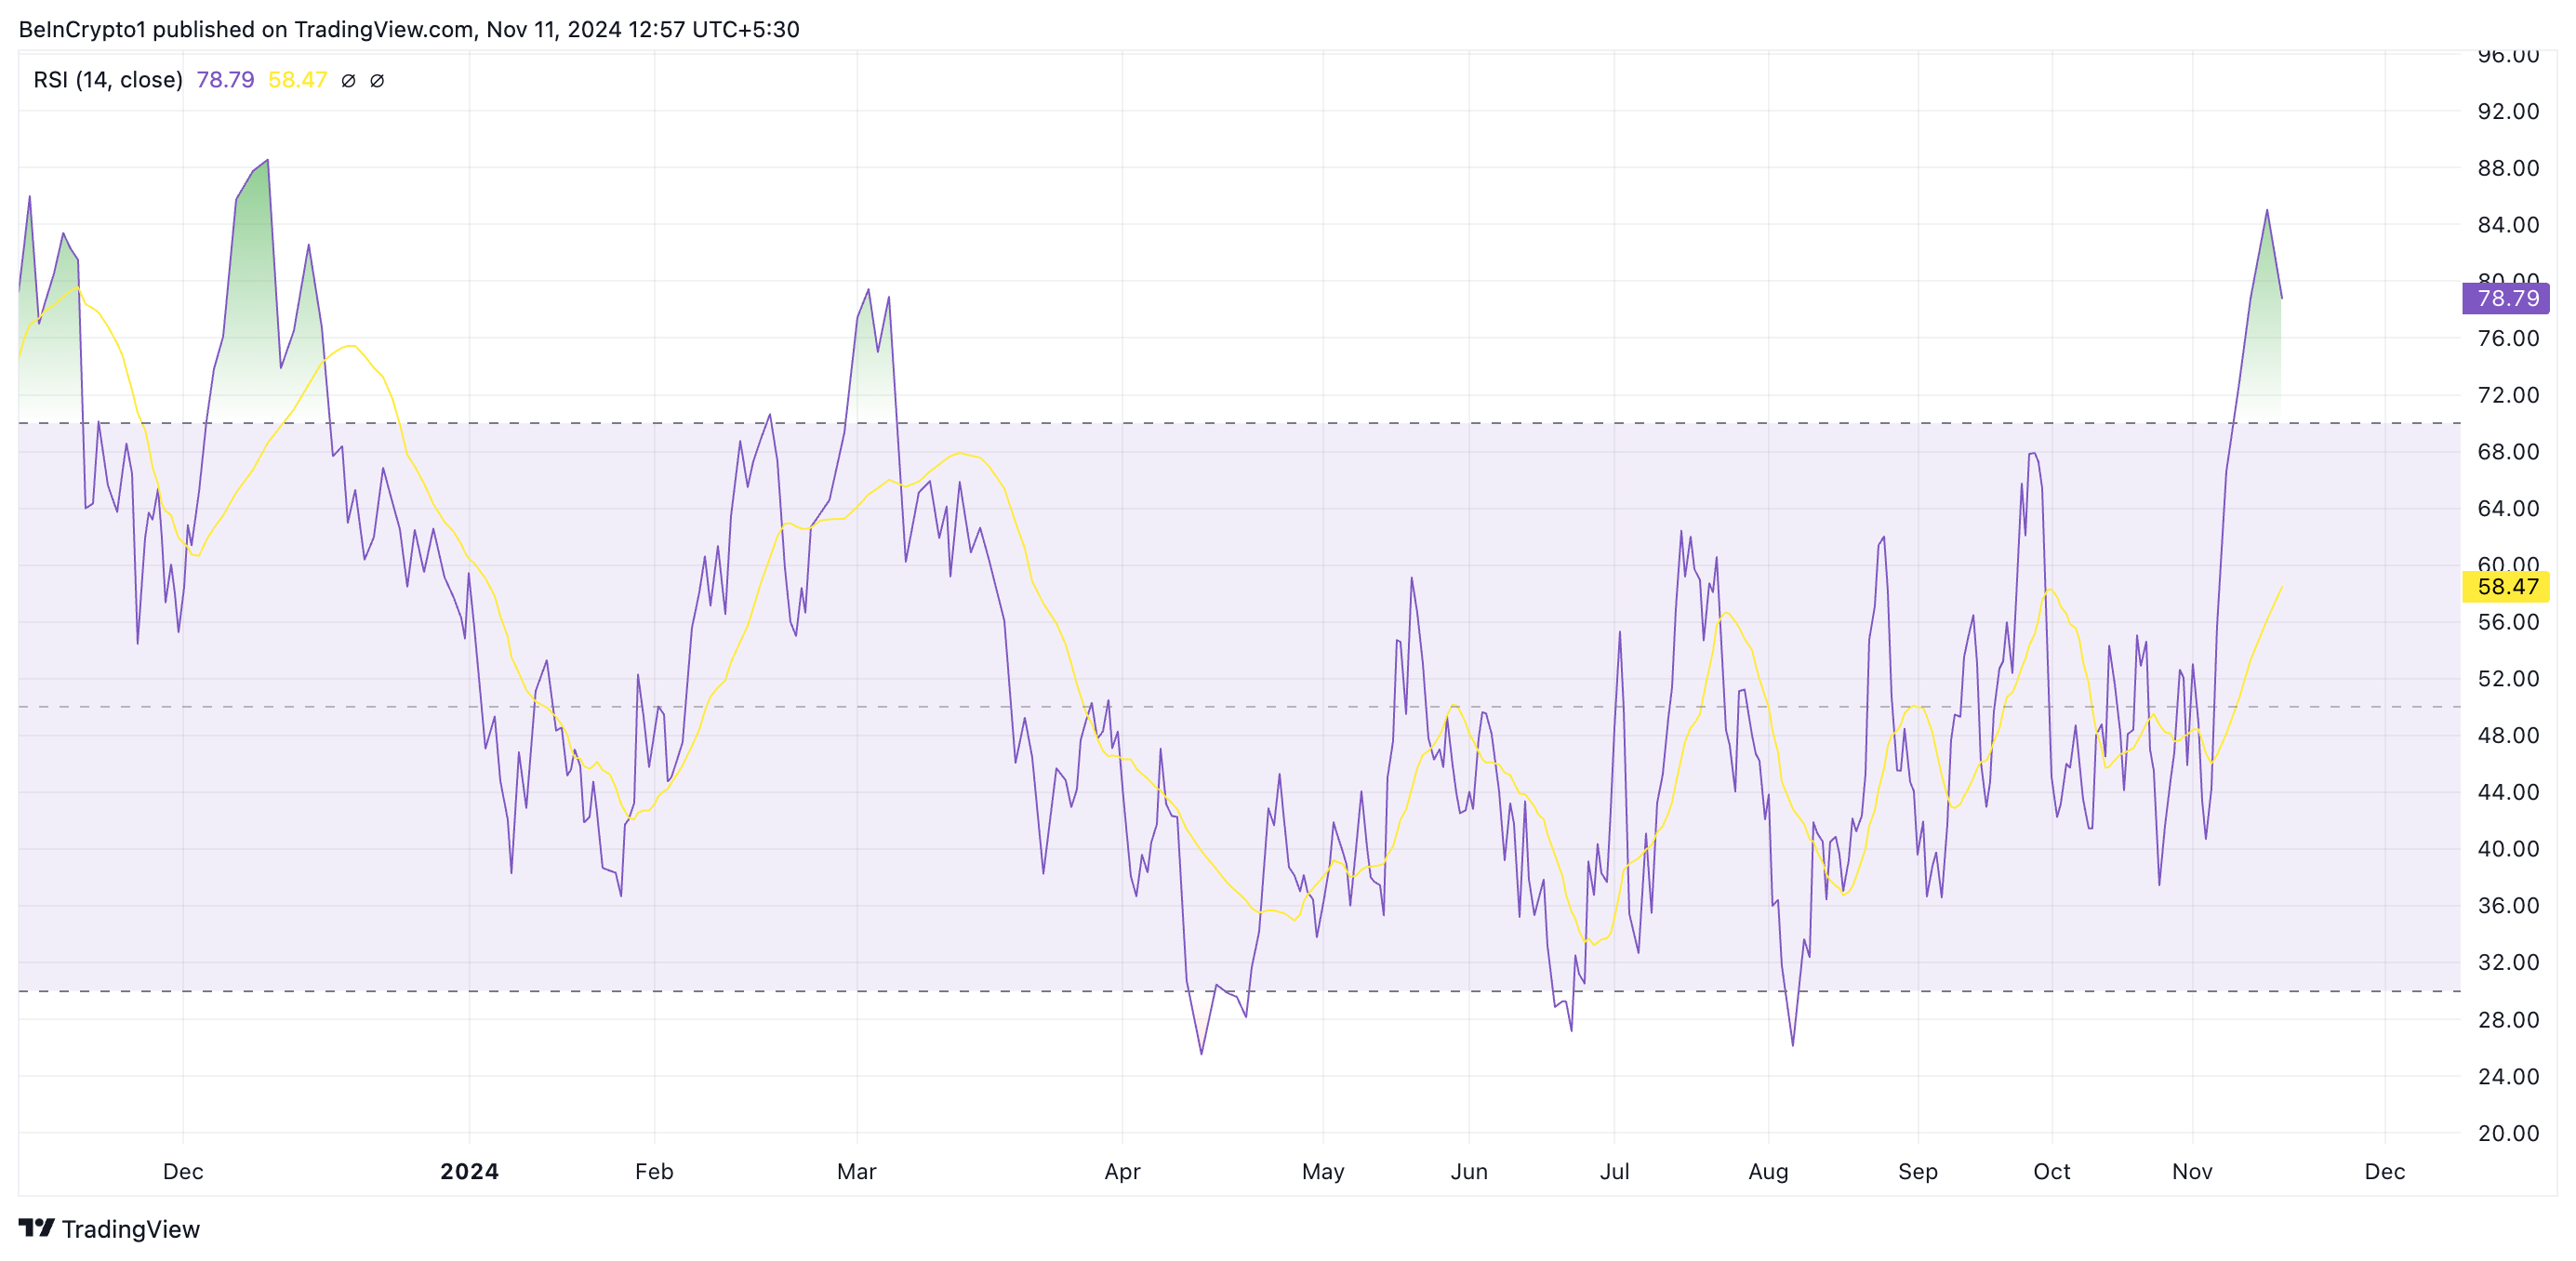
The coin’s high Relative Strength Index (RSI) is a notable indicator of this. $ADA’s RSI is at 78.79 at press time, its highest since December 2023.
This indicator measures an asset’s oversold and overbought market conditions. It ranges between 0 and 100, with values above 70 suggesting that the asset is overbought and due for a decline, while values under 30 indicate that the asset is oversold and may soon witness a rebound.

$ADA’s RSI reading of 78.79 indicates it is significantly overbought, suggesting buyers may soon start to witness exhaustion. This elevated RSI increases the likelihood of $ADA facing selling pressure, as investors could begin taking profits, potentially leading to a price pullback.
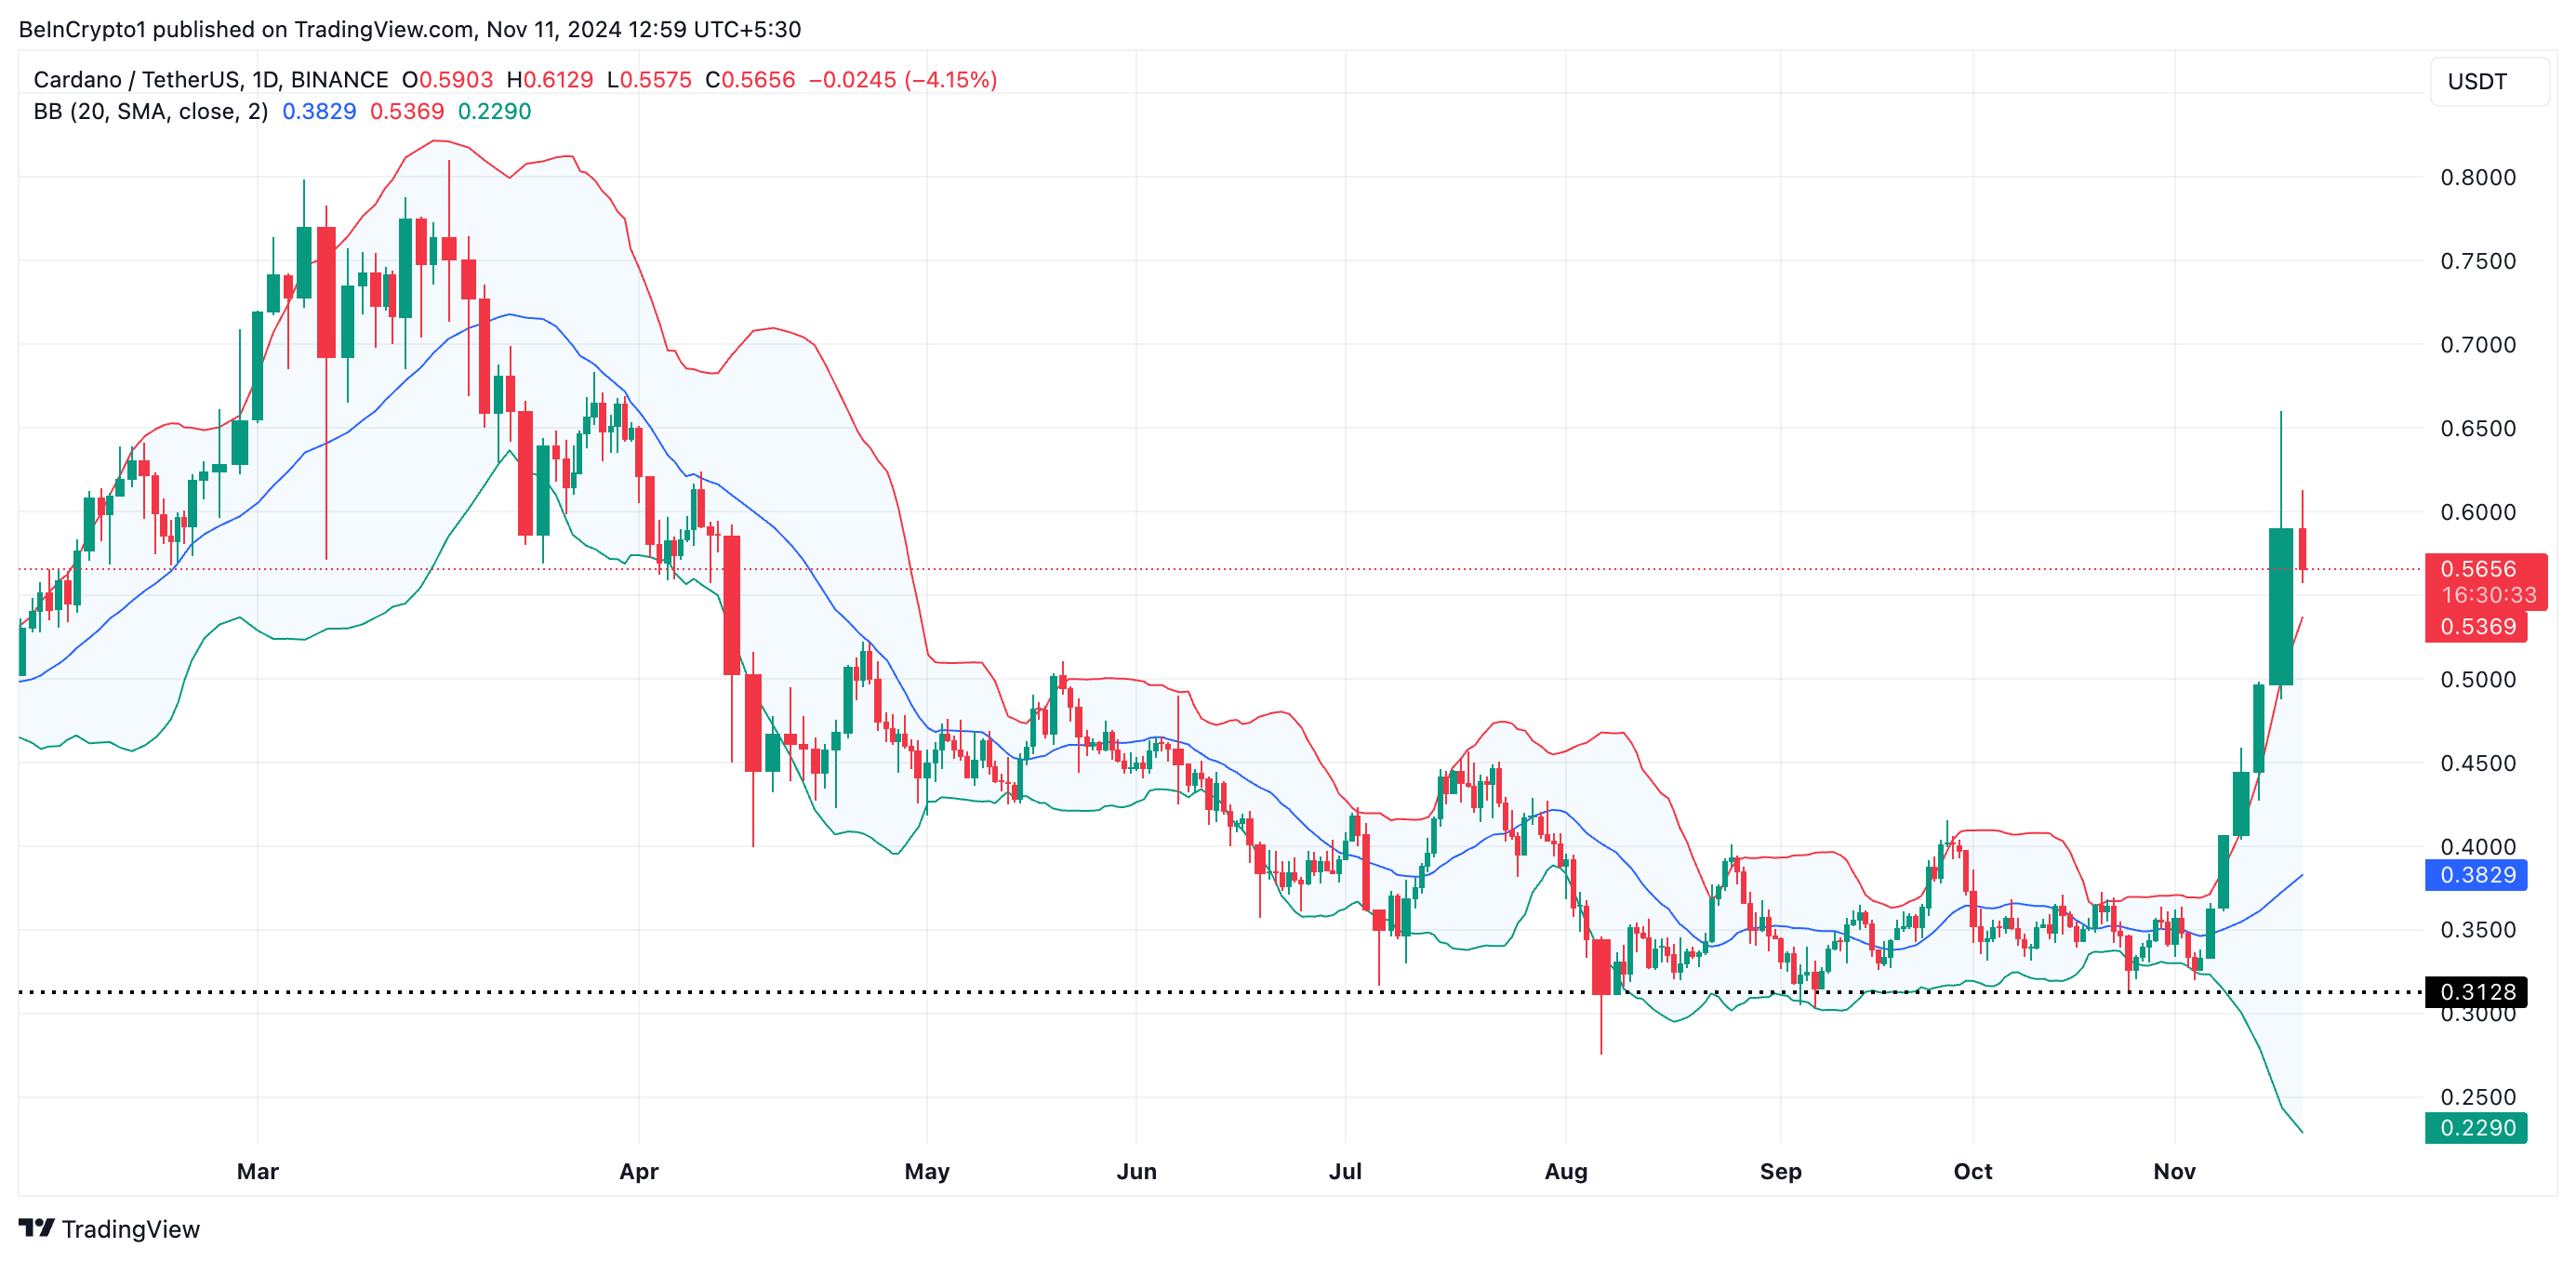
Moreover, as of this writing, $ADA’s price is above the upper band of its Bollinger Bands indicator, confirming its overbought status. The Bollinger Bands indicator measures market volatility and identifies potential buy and sell signals. It has three main components: the middle band, the upper band, and the lower band.
When an asset’s price trades above the upper band of this indicator, it suggests that the asset may be overbought and potentially overextended. Traders often interpret this as a signal to anticipate possible downward pressure; hence, they may sell once they have realized sizable gains.

$ADA Price Prediction: Key Levels To Watch
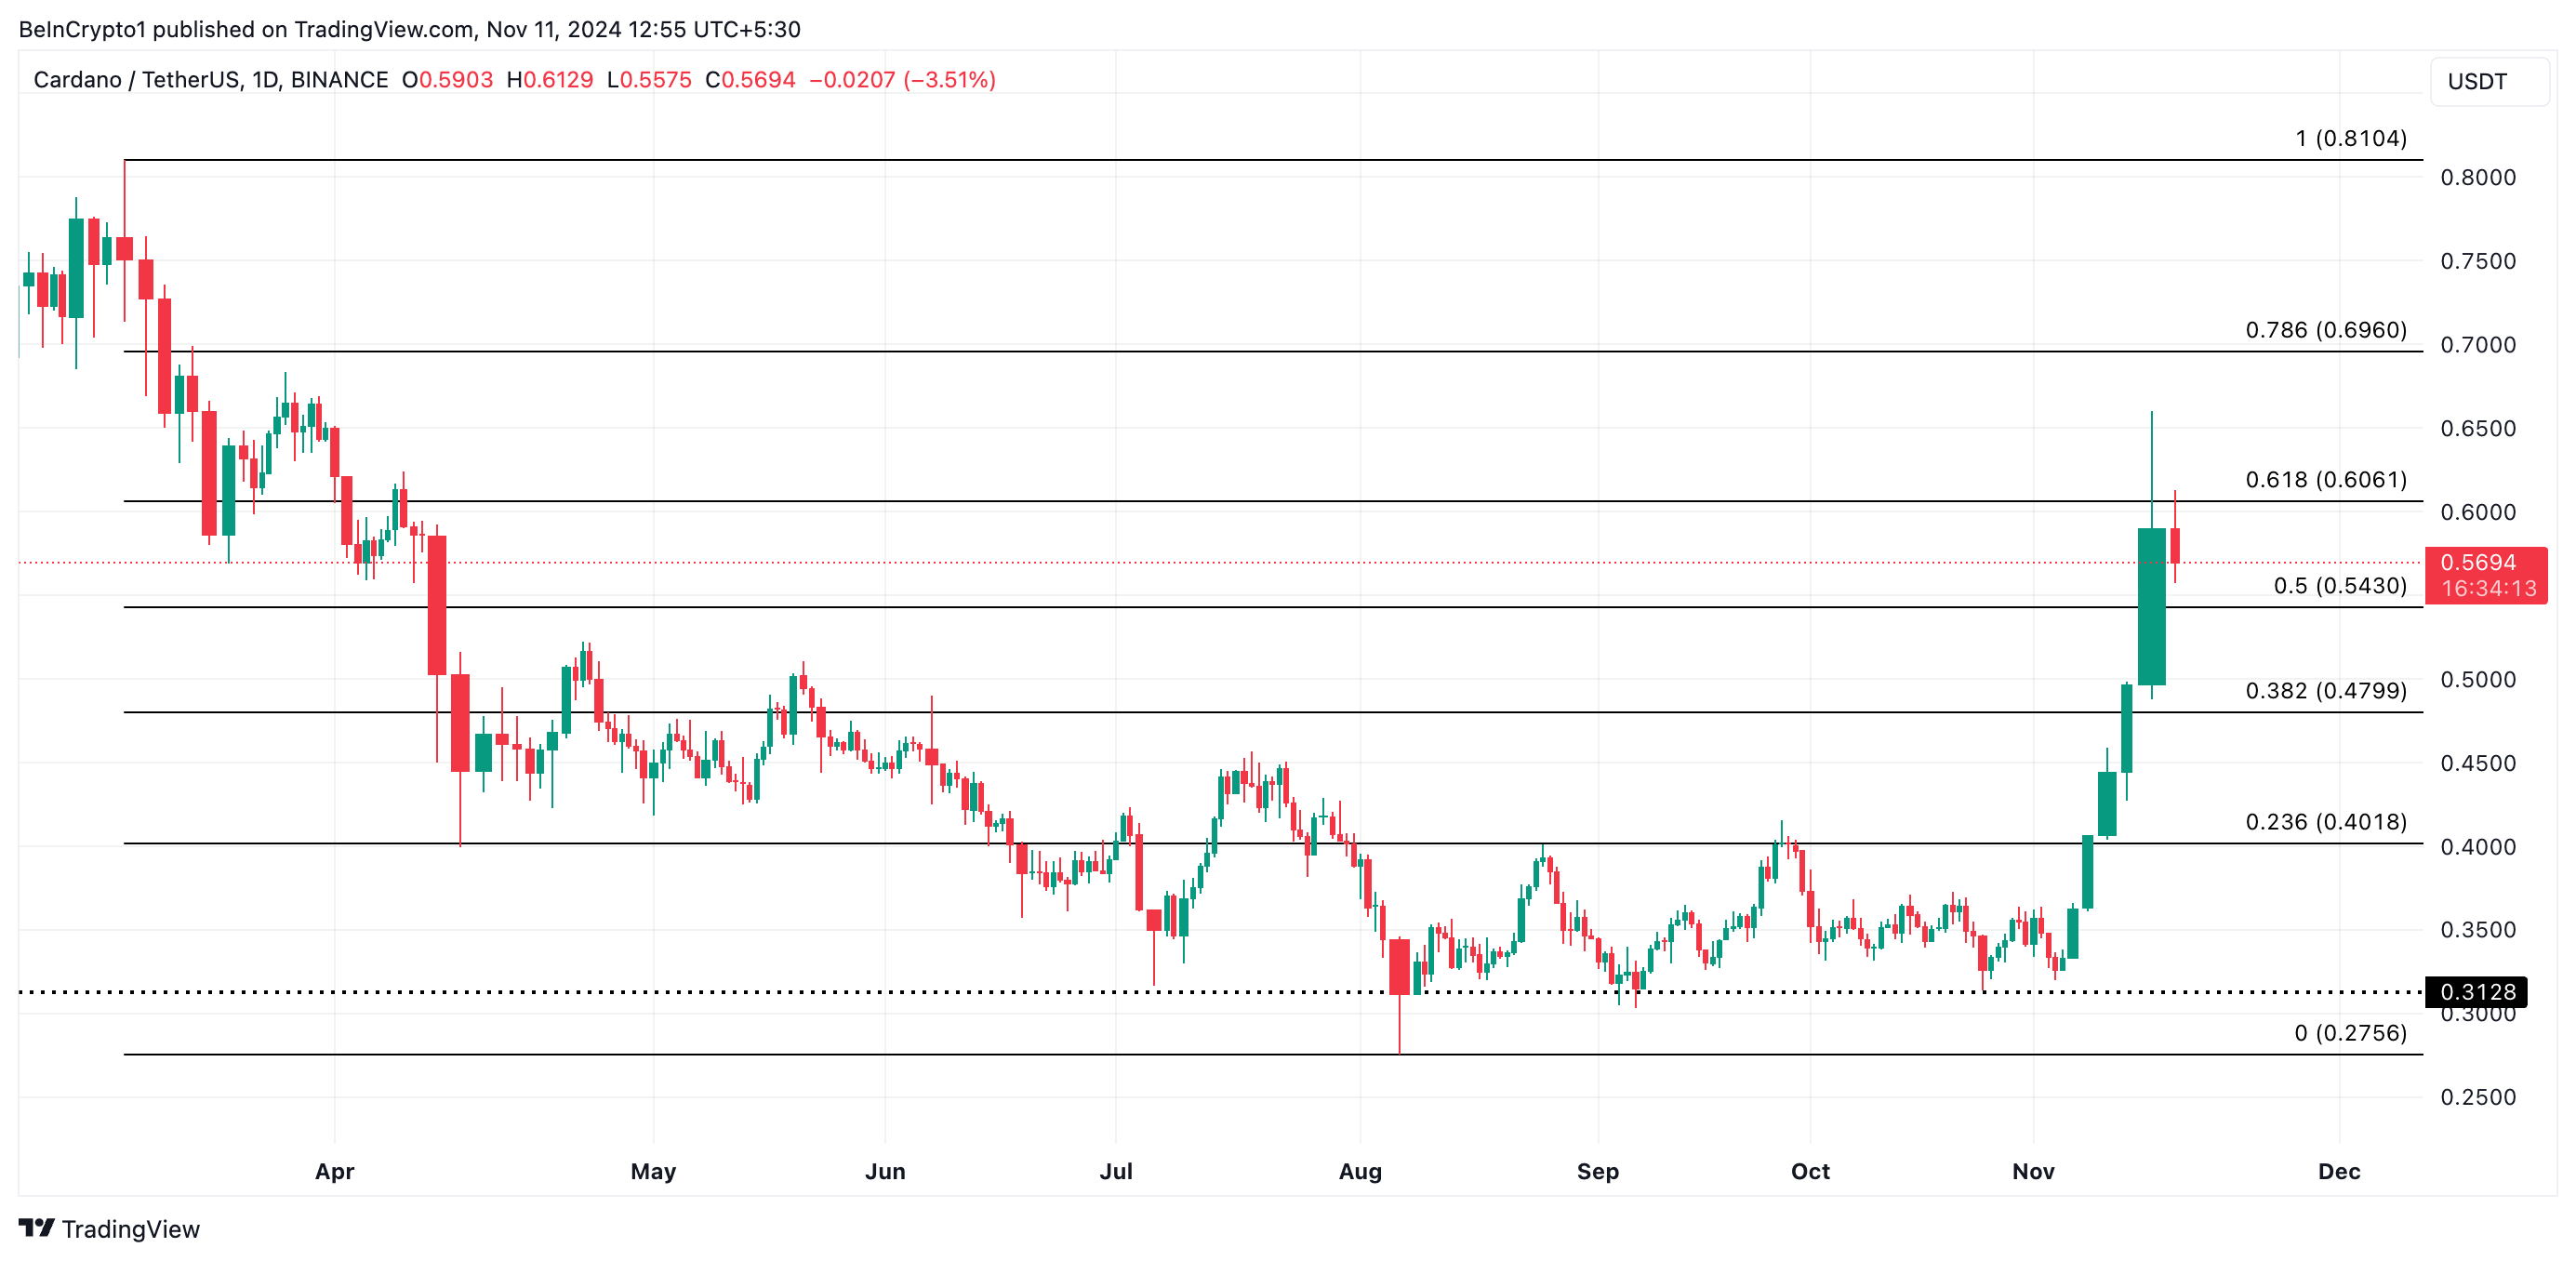
As of this writing, $ADA trades at $0.56, just below the $0.60 resistance level. Should the Cardano market become significantly overheated and buyers experience exhaustion, the price may correct, potentially dropping toward $0.54 to test it as a support floor. If this level fails to hold, $ADA’s decline could extend to $0.40.

Alternatively, if trading activity remains strong and the coin maintains its upward momentum, a successful breach of the $0.60 resistance could pave the way for Cardano’s $ADA price rally toward its year-to-date high of $0.81.
 beincrypto.com
