Bears are not going to give up so easily, according to CoinStats.
$SHIB/USD
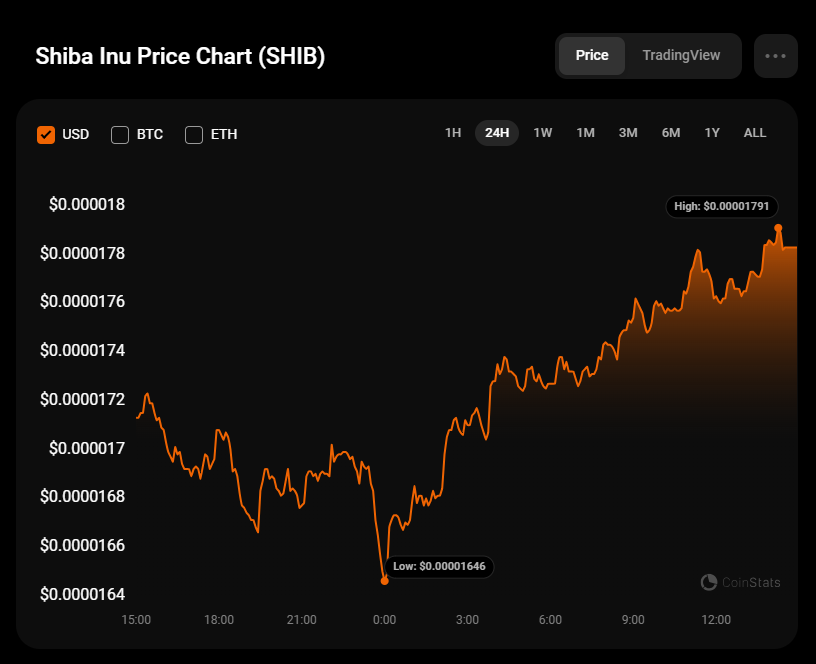
The rate of $SHIB has gone up by 3.69% over the last 24 hours.
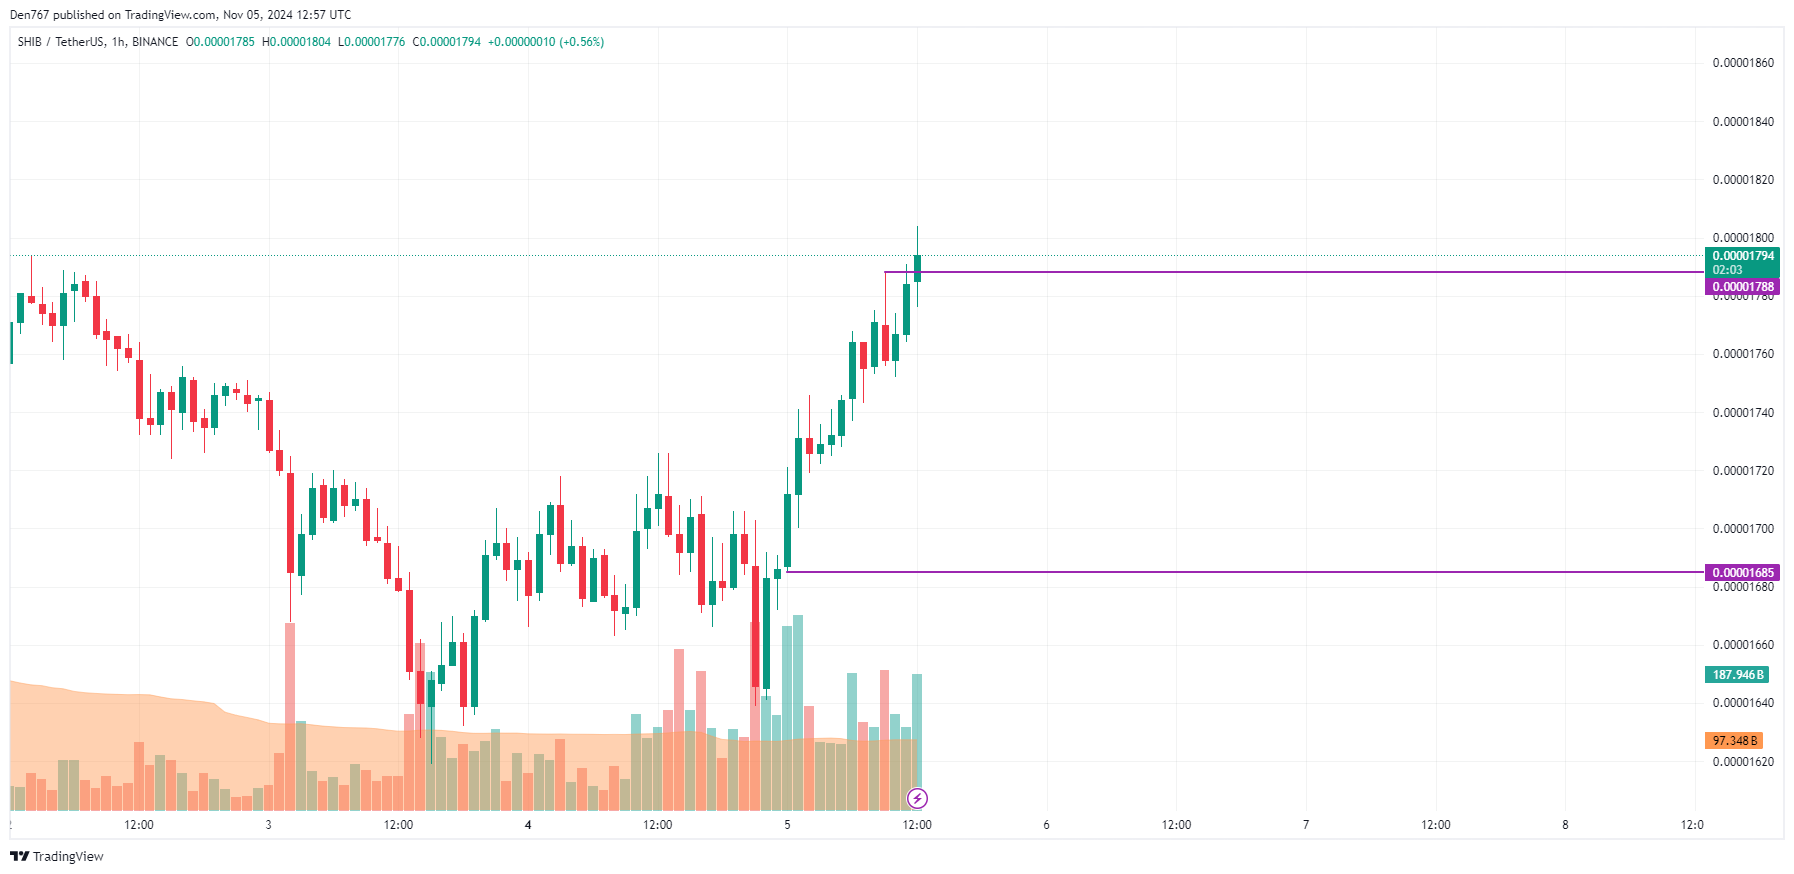
On the hourly chart, the price of $SHIB is breaking the local resistance of $0.00001788. If the daily bar closes above it, growth is likely to lead to a test of the $0.00001820-$0.00001840 range.
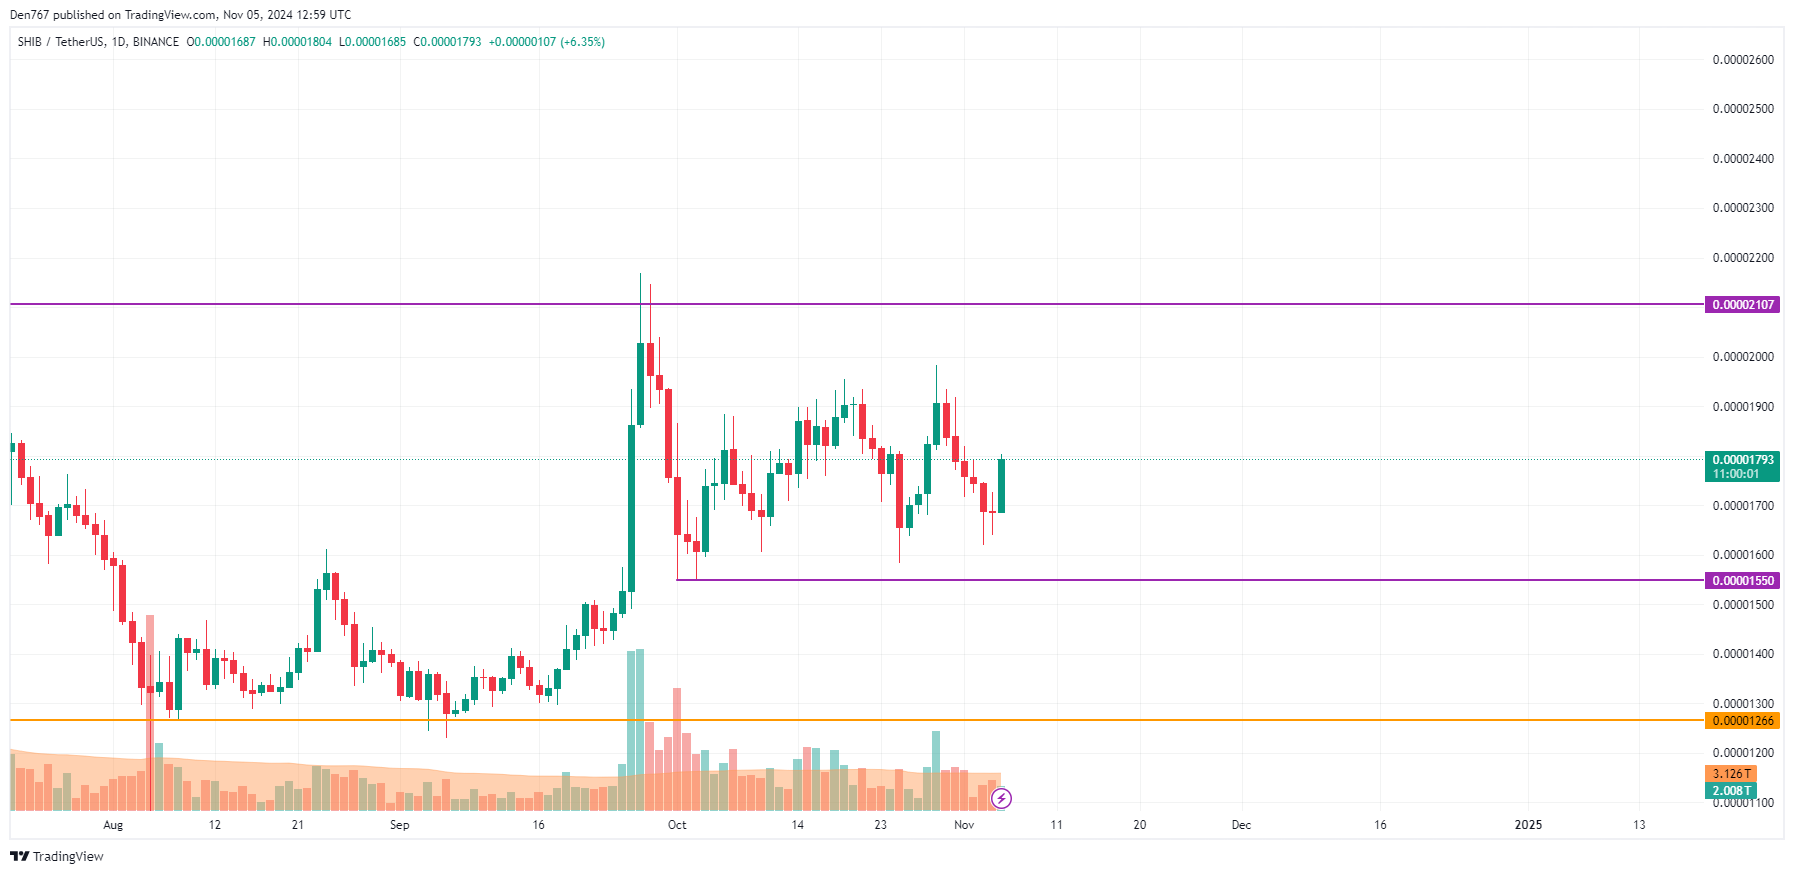
On the bigger time frame, one should focus on the daily candle's closure. If it happens near its high, the upward move may continue to the $0.000019-$0.0000020 zone soon.
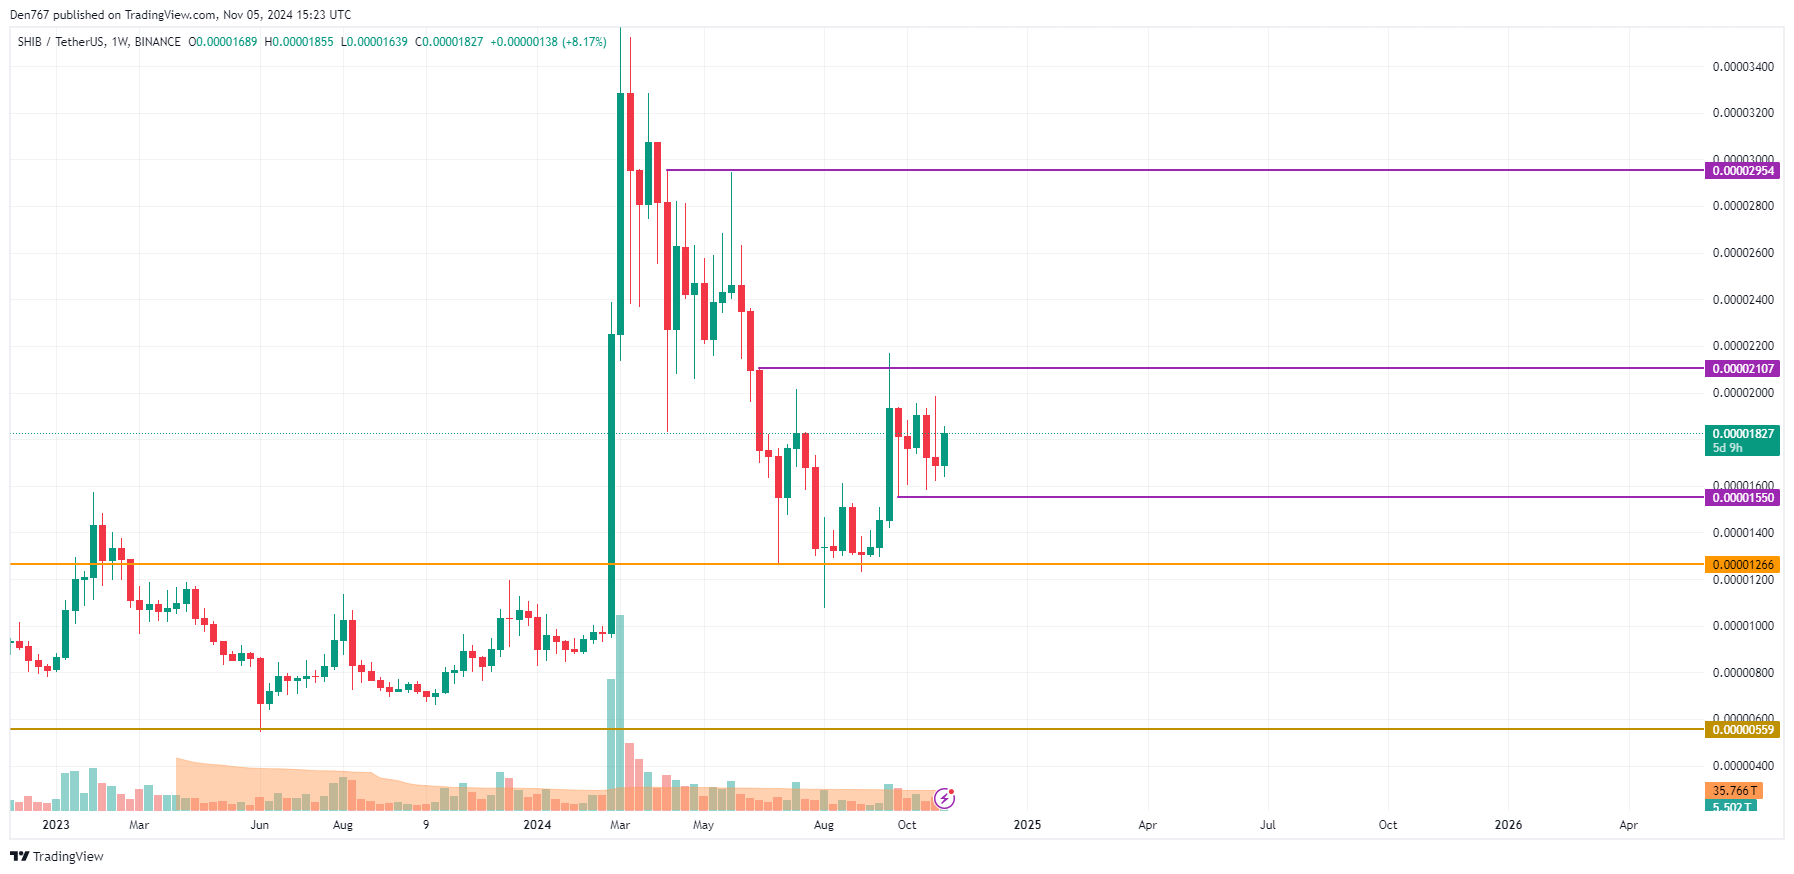
A less bullish picture can be seen on the weekly chart. The price of $SHIB is in the middle of the wide channel.
If the situation does not change by the end of the week, ongoing sideways trading in the area of $0.000018-$0.000020 is the more likely scenario.
$SHIB is trading at $0.00001832 at press time.