In the past week, Bitcoin Cash (BCH) has been in a bullish trend with prices ranging from a high of $384 to a low of $340. The price has been mostly bullish with technical signals indicating that the price may go higher in the near future.
Yet, the bearish pressure in the market in the recent past has led to some indecisiveness among traders, particularly since BCH could not breach through the $388.49 resistance level.
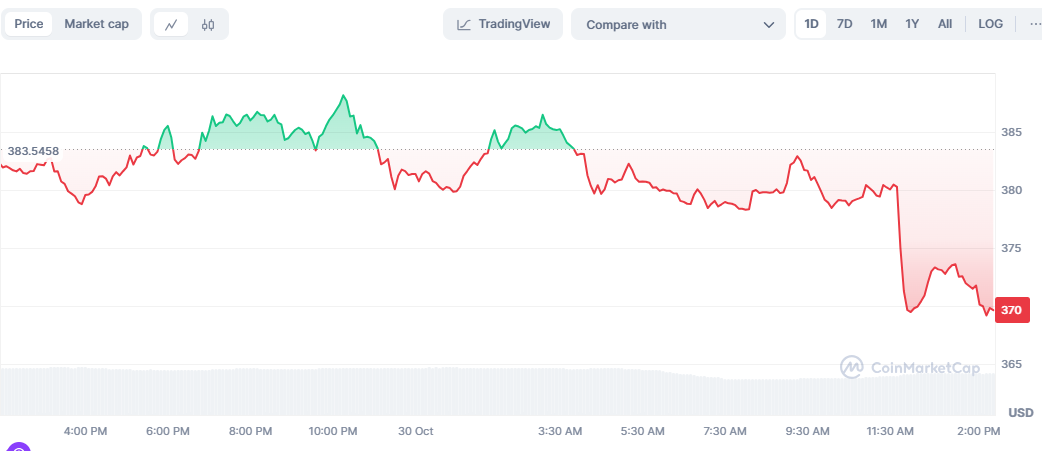
At the time of writing, BCH is changing hands at $370 with a 3.10% drop from its highest point in the day.

The price action of the recent days has also affected the market capitalization and trading volume of BCH. The BCH market capitalization has been down by 3.03% to $7.32 billion, and the 24-hour trading volume also fell by 11.50% to $391.49 million.
During this period, large value transactions were observed, including a whale transfer of 69,390 BCH (about $26.57 million) between two anonymous wallets, which may be indicative of preparation for further market action.
Golden Cross Formation on 4-Hour Chart: Bullish Signal Ahead?
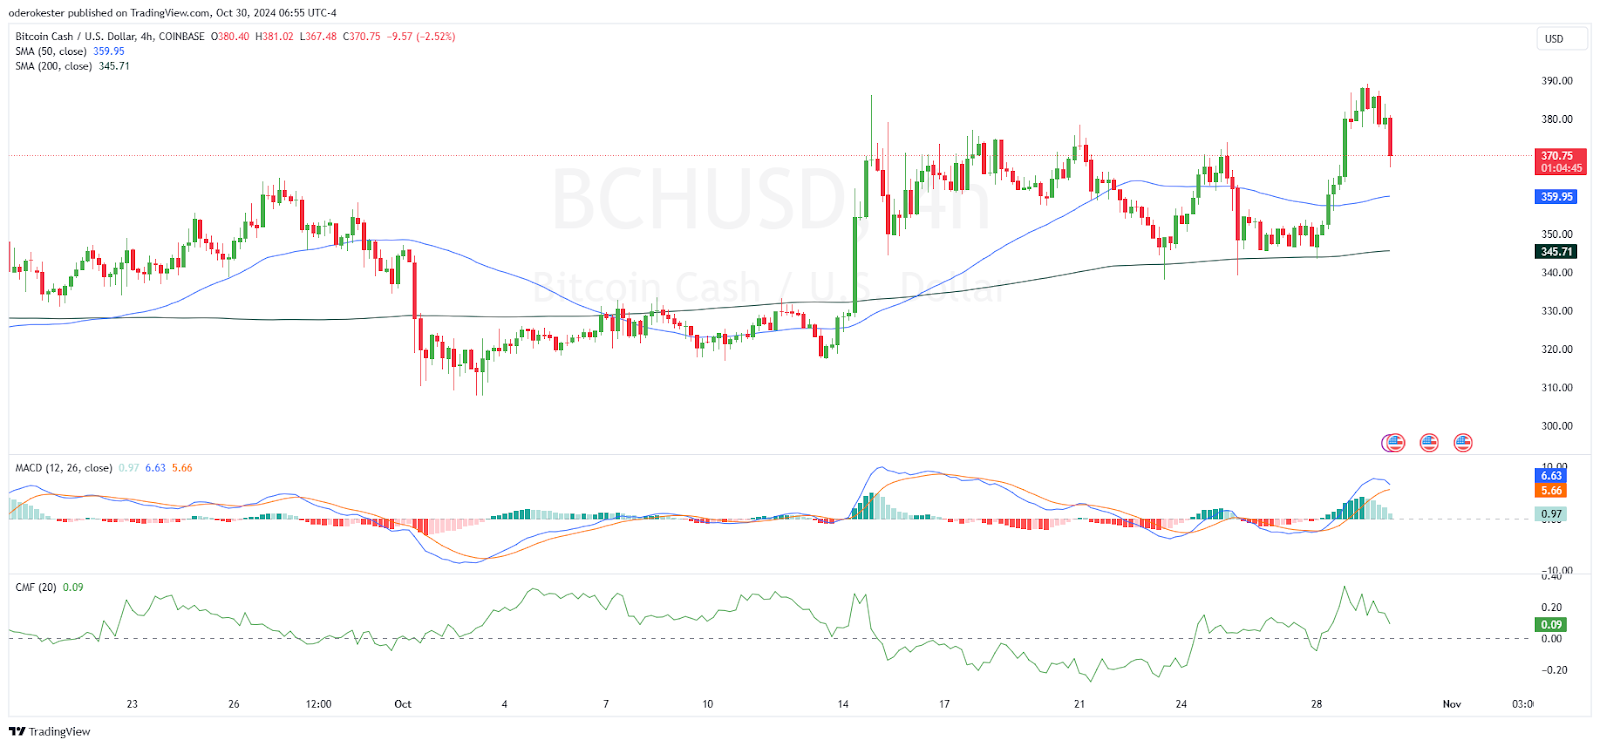
Analyzing the 4-hour chart, BCH has recently showed the Golden Cross pattern when the 50-day SMA crossed the 200-day SMA. This crossover is usually taken as a bullish signal, meaning that in the short term, the momentum is picking up compared to the long-term trend and may imply the start of an upward trend.
At the moment, the 50-day SMA is still at $359.95 and the 200-day SMA is at $345.71.
Post the Golden Cross, Bitcoin Cash (BCH) underwent a significant rise with the price reaching as high as $390 before a pullback. Nevertheless, this upward trend has hit the bar, with BCH unable to overcome the $388.49 mark.
If the price can hold above the $365 range and stay above the 50-day SMA, it could indicate another try at breaking through the next resistance levels in the coming days.

The MACD on the 4-hour chart is pointing slightly downwards, which means that the upward movement is slowing down. The MACD line is still above the signal line, which shows that buying pressure is still present, but the histogram bars have begun to diminish, which may signal a slowing down.
If the MACD line crosses under the signal line, it would mean a bearish outlook and a potential retracement to previous levels of support.
Also, the Chaikin Money Flow (CMF) is at present standing at 0.09 meaning that there is weak buying pressure. While still in positive territory, a slight drop in CMF indicates that the rates of accumulation or capital inflow may have eased, which may be indicative of waning bullish pressure. In case the CMF goes into the negative territory, it would point to selling pressure and BCH may retest the lower support levels.
Falling Wedge Pattern and RSI Indicate Potential Upside
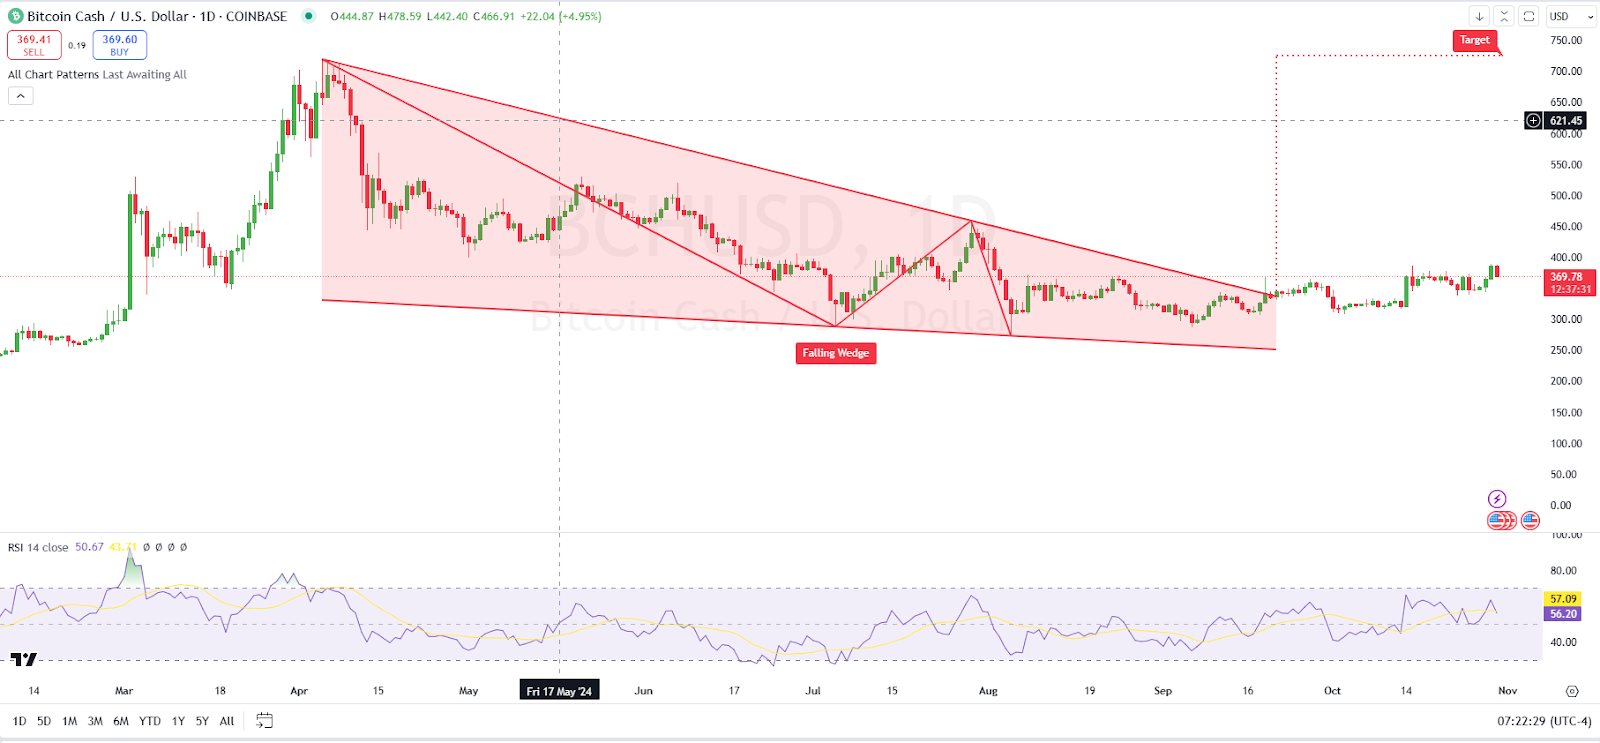
On the daily chart, BCH is also showing a falling wedge pattern, which is generally regarded as a bullish reversal pattern. This formation is defined by two converging trendlines sloping downward, indicating a period of consolidation that often precedes a breakout to the upside.
A successful breakout from this wedge pattern could propel Bitcoin Cash toward higher targets, with technical analysis suggesting a possible price target of around $750, although reaching this level would require sustained buying momentum.

The Relative Strength Index (RSI) on the daily timeframe is currently at 56.69, showing a neutral to slightly bullish stance. The RSI’s position below the overbought zone (typically above 70) indicates that BCH still has room for upward movement before hitting overbought levels.
Support and Resistance Levels to Watch For Bitcoin Cash
Immediate support for BCH lies around the $365 level, a point where the price previously consolidated. This level is critical for maintaining upward momentum, and the 50-day SMA at $360 serves as a dynamic support line.
If BCH drops below these levels, it may test the 200-day SMA at $345, which could act as the next support area. On the upside, the recent high of $390 marks a strong resistance level.
A decisive break above this point, particularly with increased trading volume, could open the path for BCH to test the psychological $400 mark. Despite these positive developments, Bitcoin Cash Open Interest has decreased by around -6.09%, now standing at approximately $218.18 million.

This decline in OI reflects a potential decrease in trader participation, possibly as they wait for clearer market direction amid the current resistance around $390. The reduction in OI might also indicate that some traders are closing positions following the recent price rally, which suggests hesitation in taking on new bullish positions at the current level.
 thecoinrepublic.com
