
Fantom (FTM) price has displayed a decisive breakout from a falling channel in a broader time frame. It has gained around 30% after the breakout.
The Fantom price triggered a pullback in the first week of October. However, it couldn’t remain bullish for longer. The token has faced resistance from a crucial zone of $0.800 and witnessed a steady fall.
However, the bearish trend has halted near the last swing low and has formed a bullish candlestick. The price was near the 200-day exponential moving average (EMA), also a support level.
Buying in Fantom Price Over Wider Frame
Kris088 (@saitokris088), a crypto analyst, claimed that the FTM crypto has the potential to perform positively. It has formed an inverted head and shoulder pattern on a weekly time frame.
Anyone seeing this forming huge inverted h&s on 1W? $FTM $S pic.twitter.com/GXUr6O7frg
— kris088 🆓️ (@saitokris088) October 26, 2024
This may invite buyers and help to push the price further. If the Fantom price overcomes the $0.800 territory, it could generate a strong buying momentum.
Could FTM Price Reclaim $1 Mark by the End of 2024?
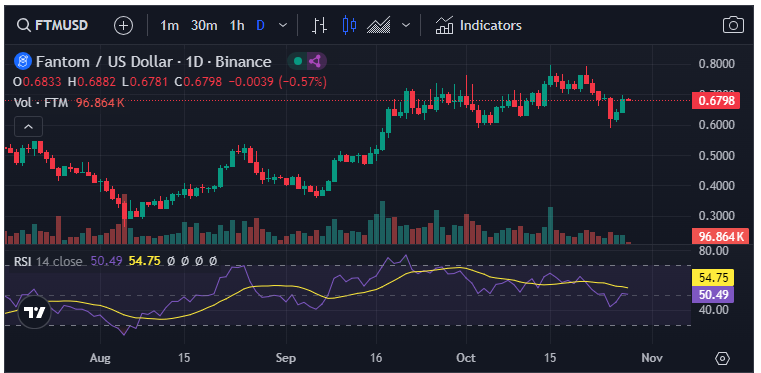
Fantom crypto was trading at $0.643 at press time. That has shown a mild gain of 0.34% over the past 24 hours. The market capitalization was $1.80 Billion.
The 24-hour trading volume dropped by 56% to $88.06 million. It showed that the engagement of investors and traders is decreasing. Since August, the Fantom crypto price has remained bullish and has managed to sustain the 200-day EMA. Defending the 200-day could be a sign of buyers’ domination.
 Track all markets on TradingView
Buyers might plan long positions if the Fantom price takes support on the 200-day EMA and exceeds the 20-day EMA. Suppose the price sustains over the 20-day EMA and surpasses the recent high, buying can be seen. Here, a single push by buyers may lift the price to the psychological level of $1.
Alternatively, if the price starts trading below the 200-day EMA, then buyers might panic. The FTM crypto may sustain below the 200-day EMA. If this happens, sellers may pull the price to the strong demand zone of $0.20.
Turning to the technical indicators, the RSI has witnessed a rapid fall and has reached 44. It was below the RSI-based moving average and heading toward the oversold zone.
The MACD has generated a bearish crossover with the Signal line. However, it is holding over the Zero line. However, the histograms have flipped to red, which indicates the bearish forecast.
Fantom Price Prediction Based on Technical Chart
Fantom price has displayed significant volatility. Its recent breakout from a falling channel and subsequent price fluctuations marked it. While it managed to gain 30% post-breakout, current resistance at the $0.800 level has hindered its bullish momentum.
The stabilization near the 200-day EMA offered a glimmer of hope for buyers. However, a sustained drop below this level could increase selling pressure. This could drive the price down to $0.20.
The technical indicators suggest caution, as the RSI and MACD point towards bearish sentiment. For FTM to reclaim the $1 mark by the end of 2024, it must maintain support at the 200-day EMA. The token needs to show consistent upward movement past the 20-day EMA.