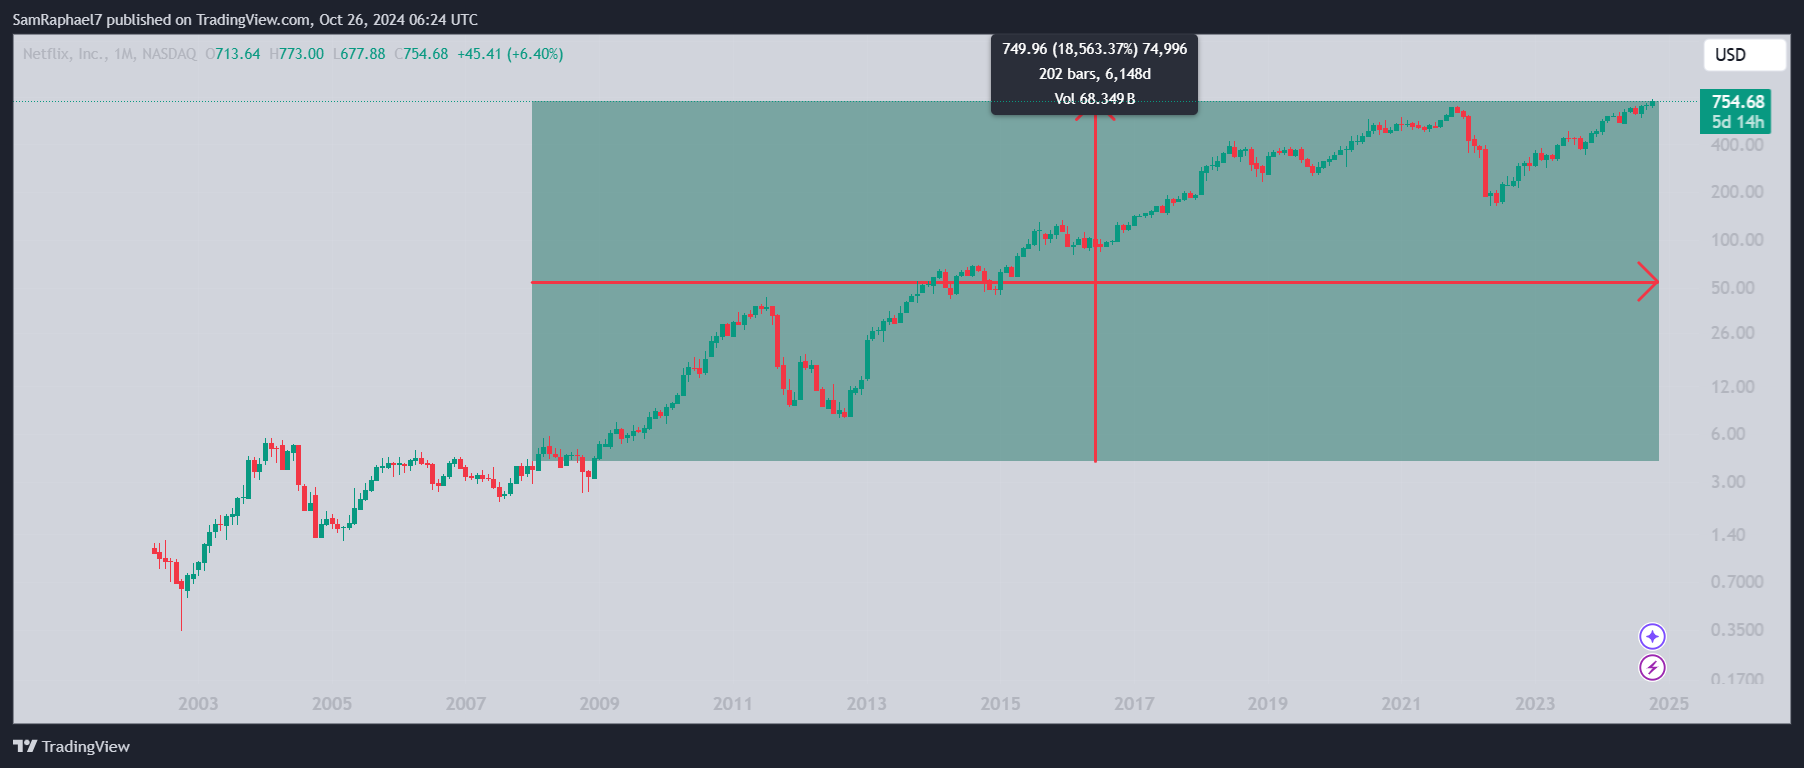
A comparison of XRP price trajectory to Netflix stock suggests XRP still has some rally in it, with its exponential growth potentially pushing prices to $95.
XRP’s price has struggled over the past few years due to what many consider a price suppression scheme. Following its impressive 60,000% run to $3.31 in early 2018, XRP has failed to recover from the retracement that followed this price uptick.
XRP’s Underperformance
For context, XRP faced a major correction from the $3.31 peak in January 2018. By March 2020, the altcoin had dropped by more than 96% to a floor price of $0.11.
Despite recovering, XRP has failed to reclaim the $1 price mark since dropping below it in December 2021, nearly three years ago. Amid the underperformance, investors have lamented XRP’s price movements. However, market watchers like EGRAG believe patience is important.
In his latest analysis, EGRAG compared XRP’s price trajectory with the stock of the streaming giant Netflix (NFLX). Interestingly, a visual representation of the monthly charts of both assets shows that XRP has been trading in a similar trajectory to Netflix.
Netflix Price Performance Since 2002
Notably, from October 2002, NFLX recorded a series of impressive and disappointing price movements. Particularly, NFLX spiked from a low of $0.3464 in October 2002 to a peak of $5.64 in February 2004. This marked a massive 1,528% rally in less than two years.
After the $5.64 top, Netflix witnessed a major correction, dropping to a low of $1.32 before eventually recovering. Despite the recovery, the stock failed to reclaim its previous high for half a decade. During this period, NFLX faced a consolidation, which possibly triggered concerns among investors.

However, when NFLX eventually broke out in December 2008, the resulting price surge led to a massive rally to $43 by July 2011. Amid a series of upswings and declines, Netflix has surged by 18,563% since February 2008, as it now trades for $754.68.
XRP Trailing NFLX Trajectory
EGRAG’s chart suggests that XRP is currently moving in a similar path to NFLX. Notably, data from the comparison indicates that XRP’s current price position mirrors Netflix’s price level in February 2008, when doubts emerged during an extensive consolidation phase.
For context, XRP witnessed Netflix’s October 2002 to February 2004 spike when it rallied from January 2017 to January 2018. XRP also faced a similar correction to what Netflix witnessed afterward. Now, XRP is facing the same consolidation trend.
If XRP continues to track Netflix’s trajectory, its price could witness a rally in the coming months. To put things into perspective, XRP, which currently trades for $0.5131, would hit $95.7 if it recorded the same 18,563% rally Netflix has observed since February 2008. However, this might take years to materialize.
 thecryptobasic.com