According to Coinglass, if Ripple’s (XRP) price hits $0.60, it will wipe out millions of dollars in open contracts. The derivatives information portal indicates that this level represents the highest XRP liquidation price.
Currently, XRP trades at $0.52, having dropped from $0.60 at the beginning of October. Besides revealing the possible liquidation levels, this analysis checks if the altcoin has the potential to rebound.
Ripple Short Traders Expose Millions to Liquidation
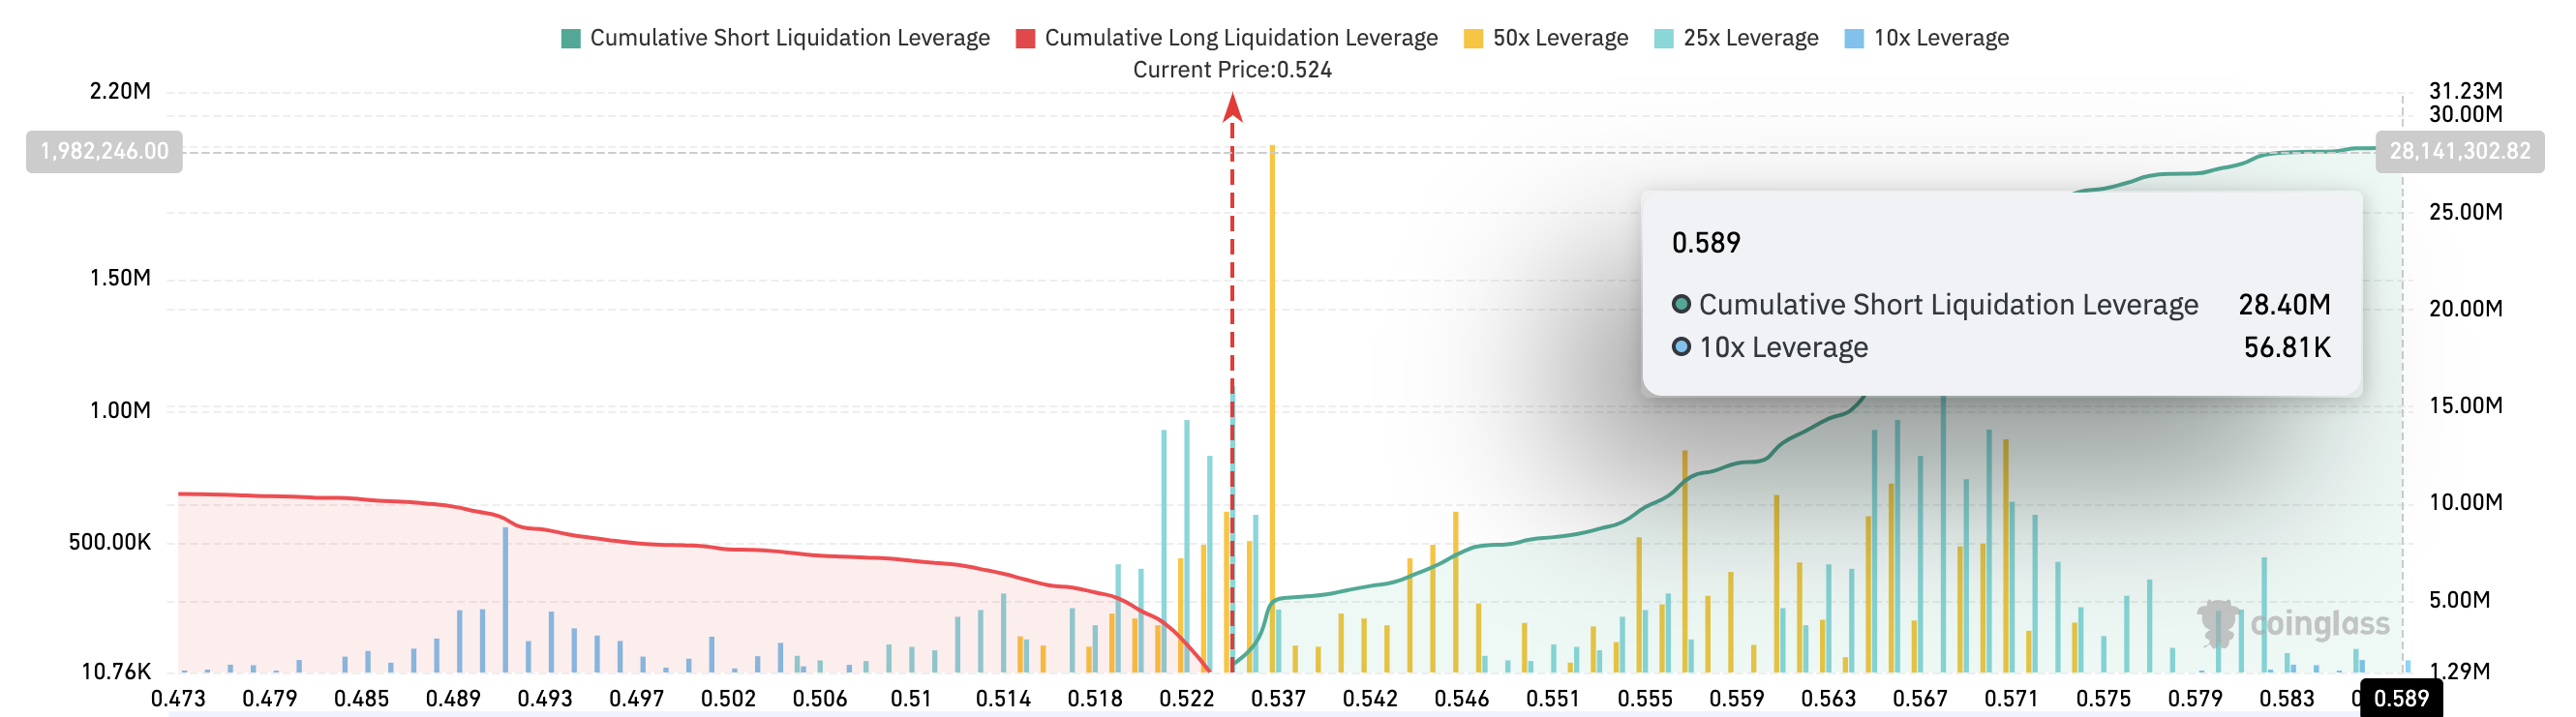
As of this writing, the liquidation map reveals that XRP’s price action has prompted many traders to open short contracts valued at $28.40 million. A liquidation map helps traders identify potential levels where significant positions may be forced to close due to margin calls.
For context, a short contract indicates a market position anticipating that a cryptocurrency’s value will decline.
Conversely, long contracts, which reflect positions predicting price increases, are valued at $10.50 million. Therefore, this significant disparity suggests a bearish sentiment among traders. Further, this highlights the potential for massive liquidation if XRP’s price rebounds significantly.
Read more: XRP ETF Explained: What It Is and How It Works
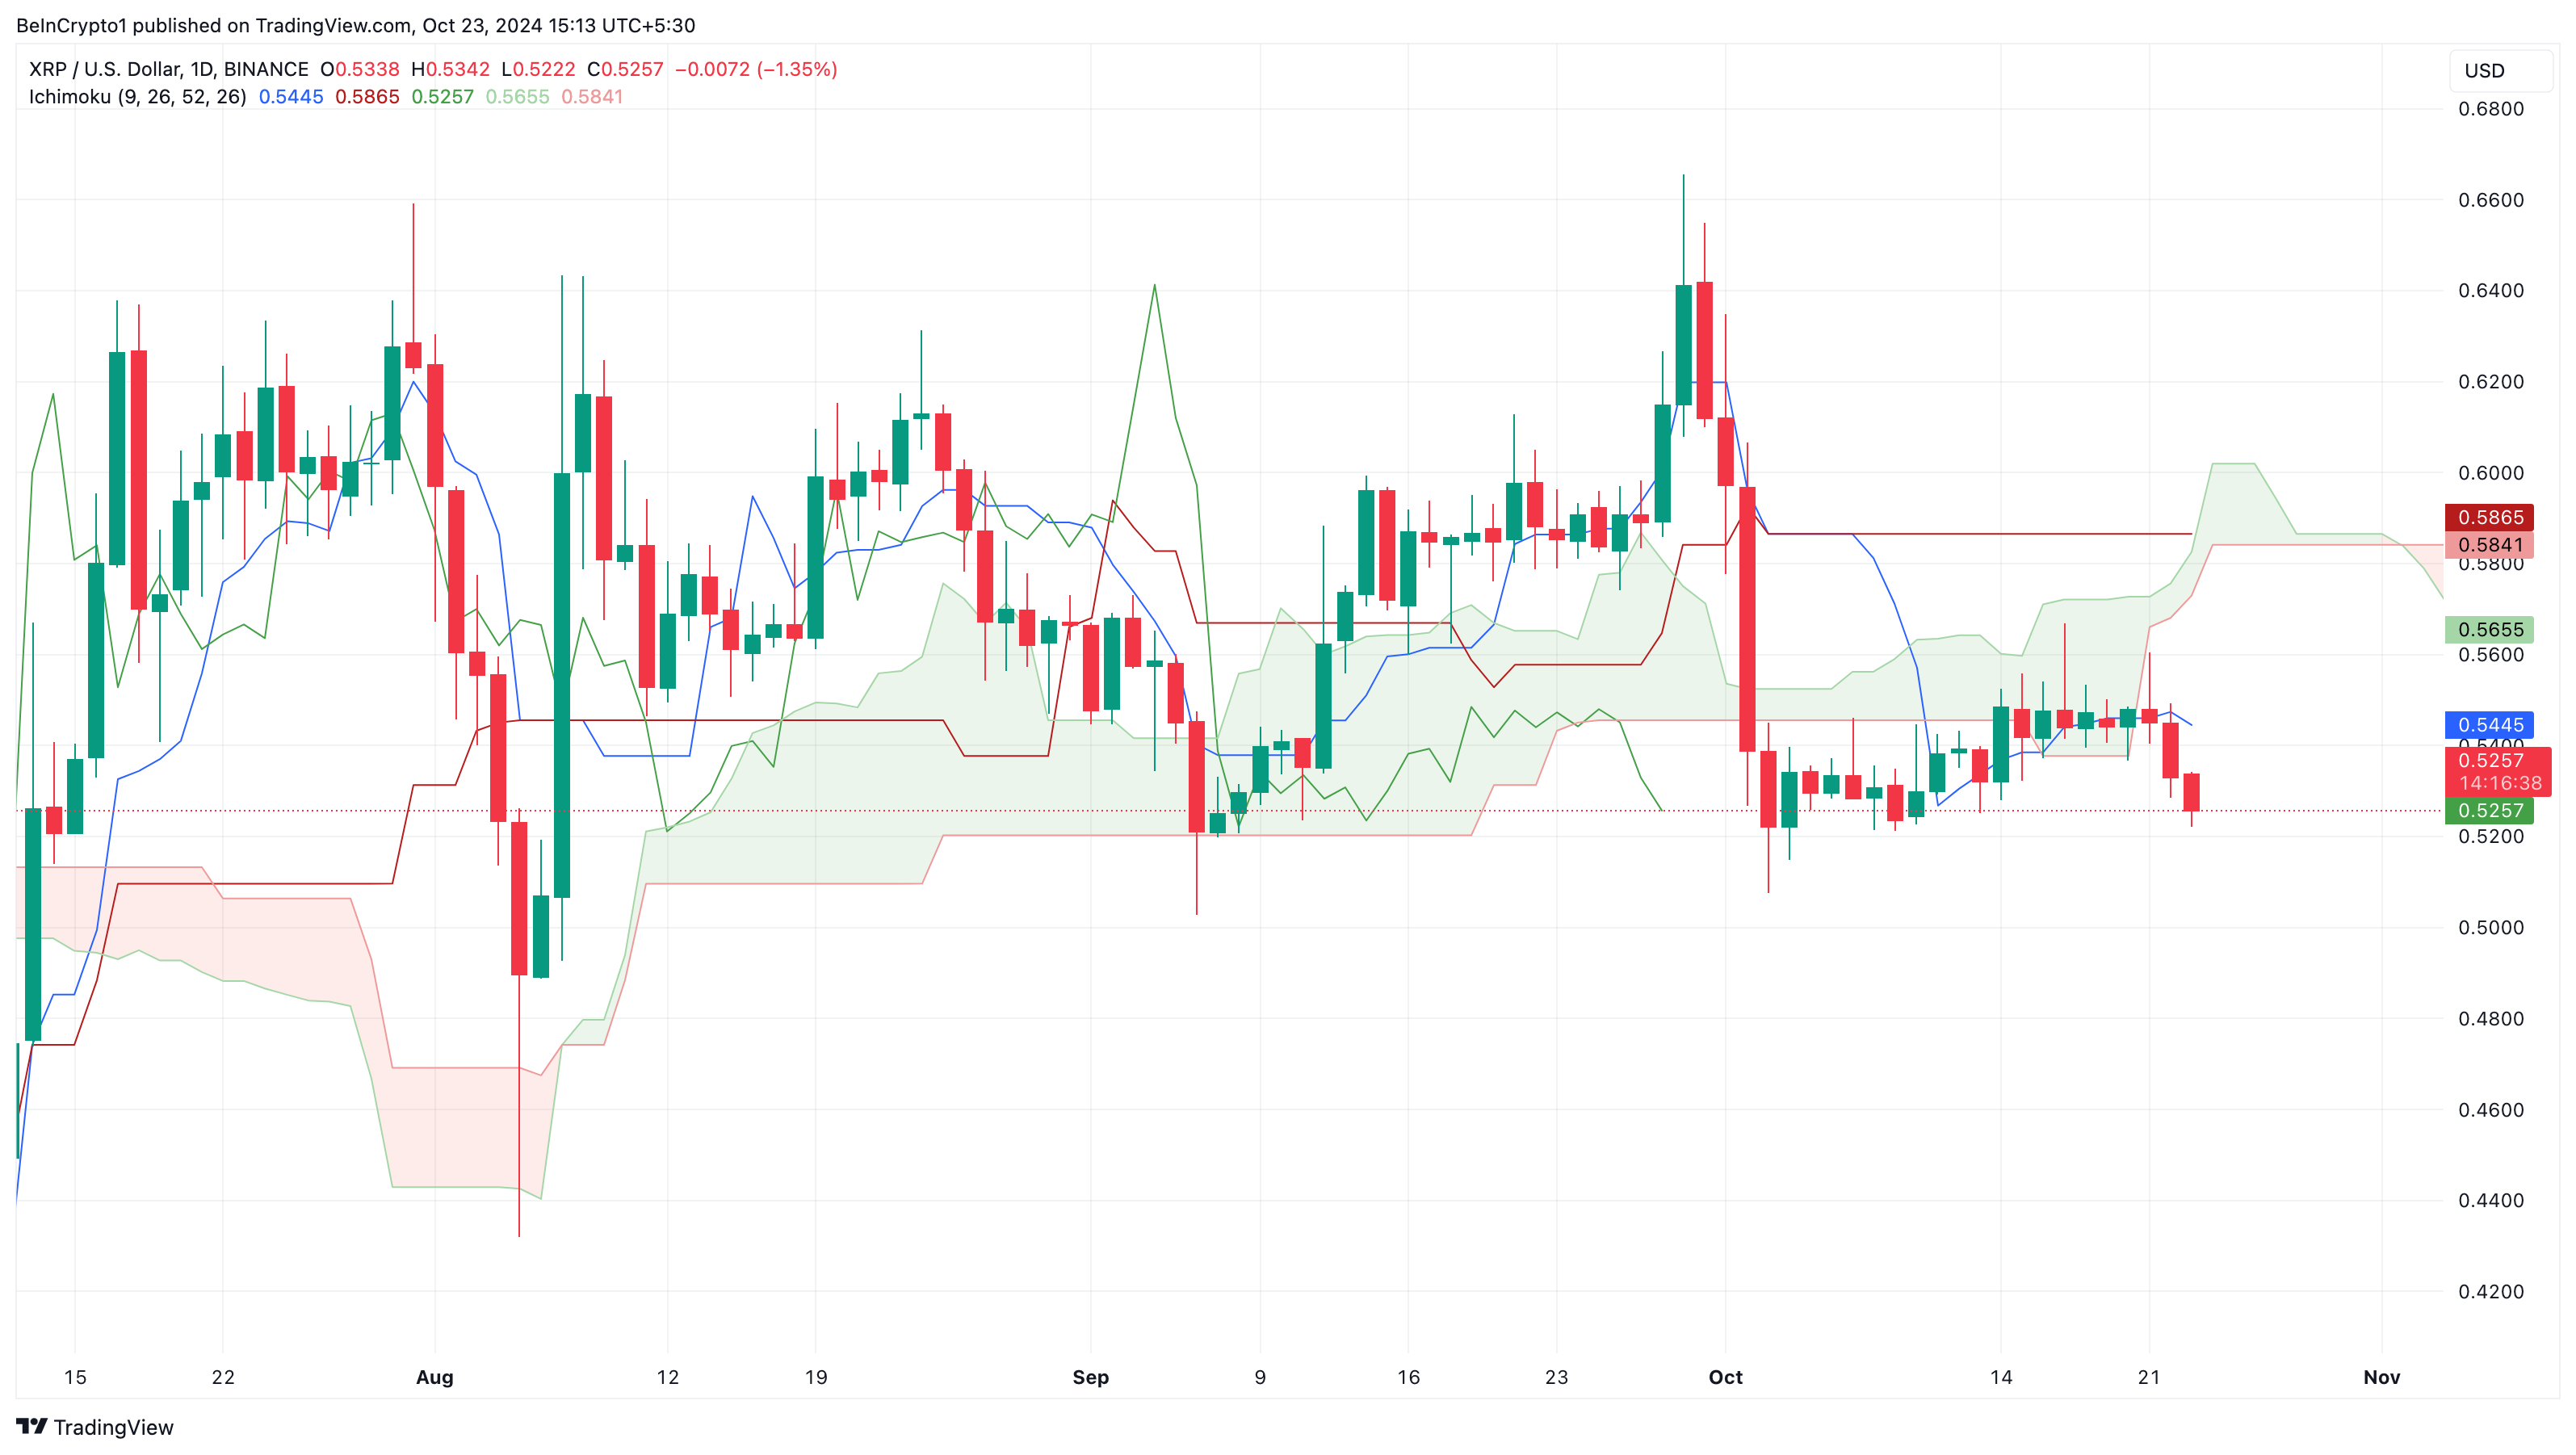
However, a look at the Ichimoku Cloud shows that the altcoin currently faces resistance that could hinder a quick rebound. The Ichimoku Cloud gives a general overview of the market trend and spot support and resistance points.
When the cloud is above a cryptocurrency’s price, the trend is bearish. On the other hand, if the cloud is below the price, the trend is bullish, and support is strong to drive an increase. As seen below, it is the former, suggesting that it might be challenging to hit the mentioned XRP liquidation price in the short term.
XRP Price Prediction: Support Not Strong
An assessment of the XRP/USD shows that the token has fallen below the major Exponential Moving Averages (EMA). As shown below, the 20-day EMA (blue) and 50 EMA (yellow) are both above XRP’s price.
Typically, when the price falls below these indicators, the trend is bearish. Also, the fact that the longer EMA has risen above the shorter one indicates that XRP could accelerate this recent downtrend.
Read more: Ripple (XRP) Price Prediction 2024/2025/2030
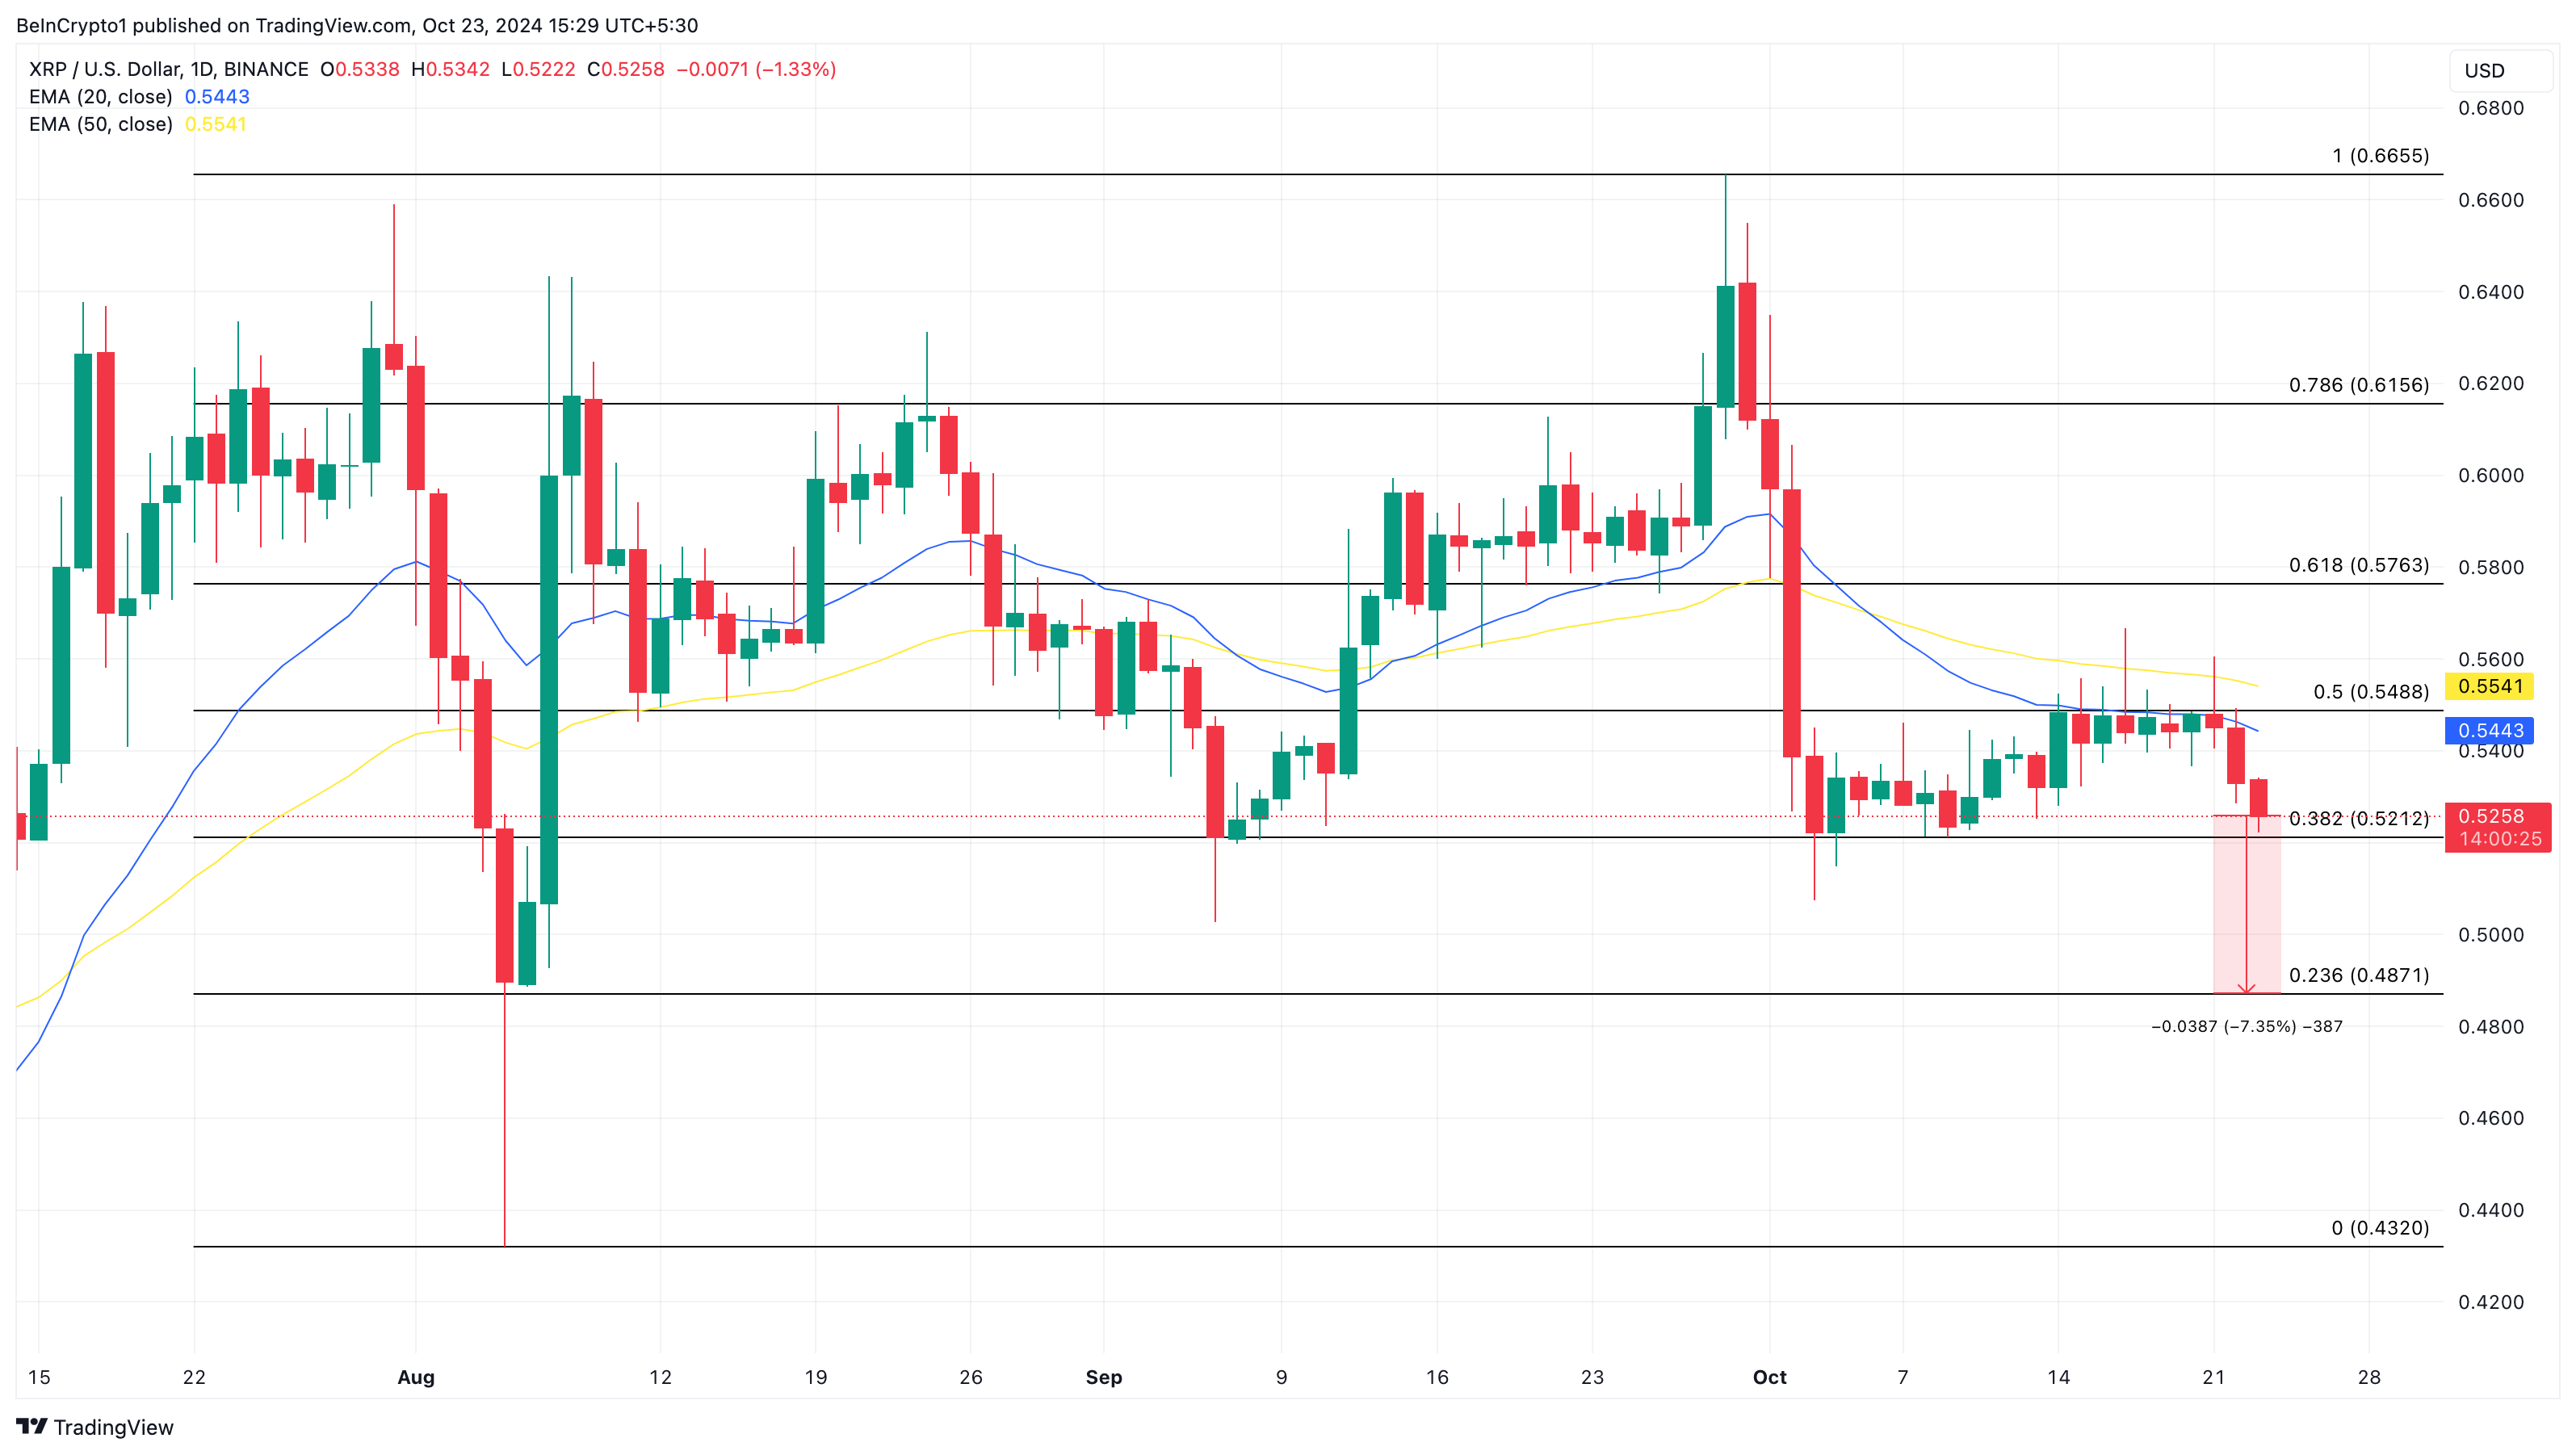
If this continues, XRP’s price might drop to $0.49. On the other hand, a break above the $0.55 resistance could bring the mentioned XRP liquidation price to life in the short term.