Ripple (XRP) price has been under considerable pressure recently, driven by bearish technical indicators and legal challenges. Despite a recent decline, some signs hint that the selling pressure could be easing, as indicated by a recovery in RSI levels.
However, XRP whales remain cautious, showing little change in their holdings, suggesting uncertainty about a strong price surge. For now, XRP’s future hinges on whether it can overcome resistance levels and gather bullish momentum.
XRP Whales Are Still Not Convinced
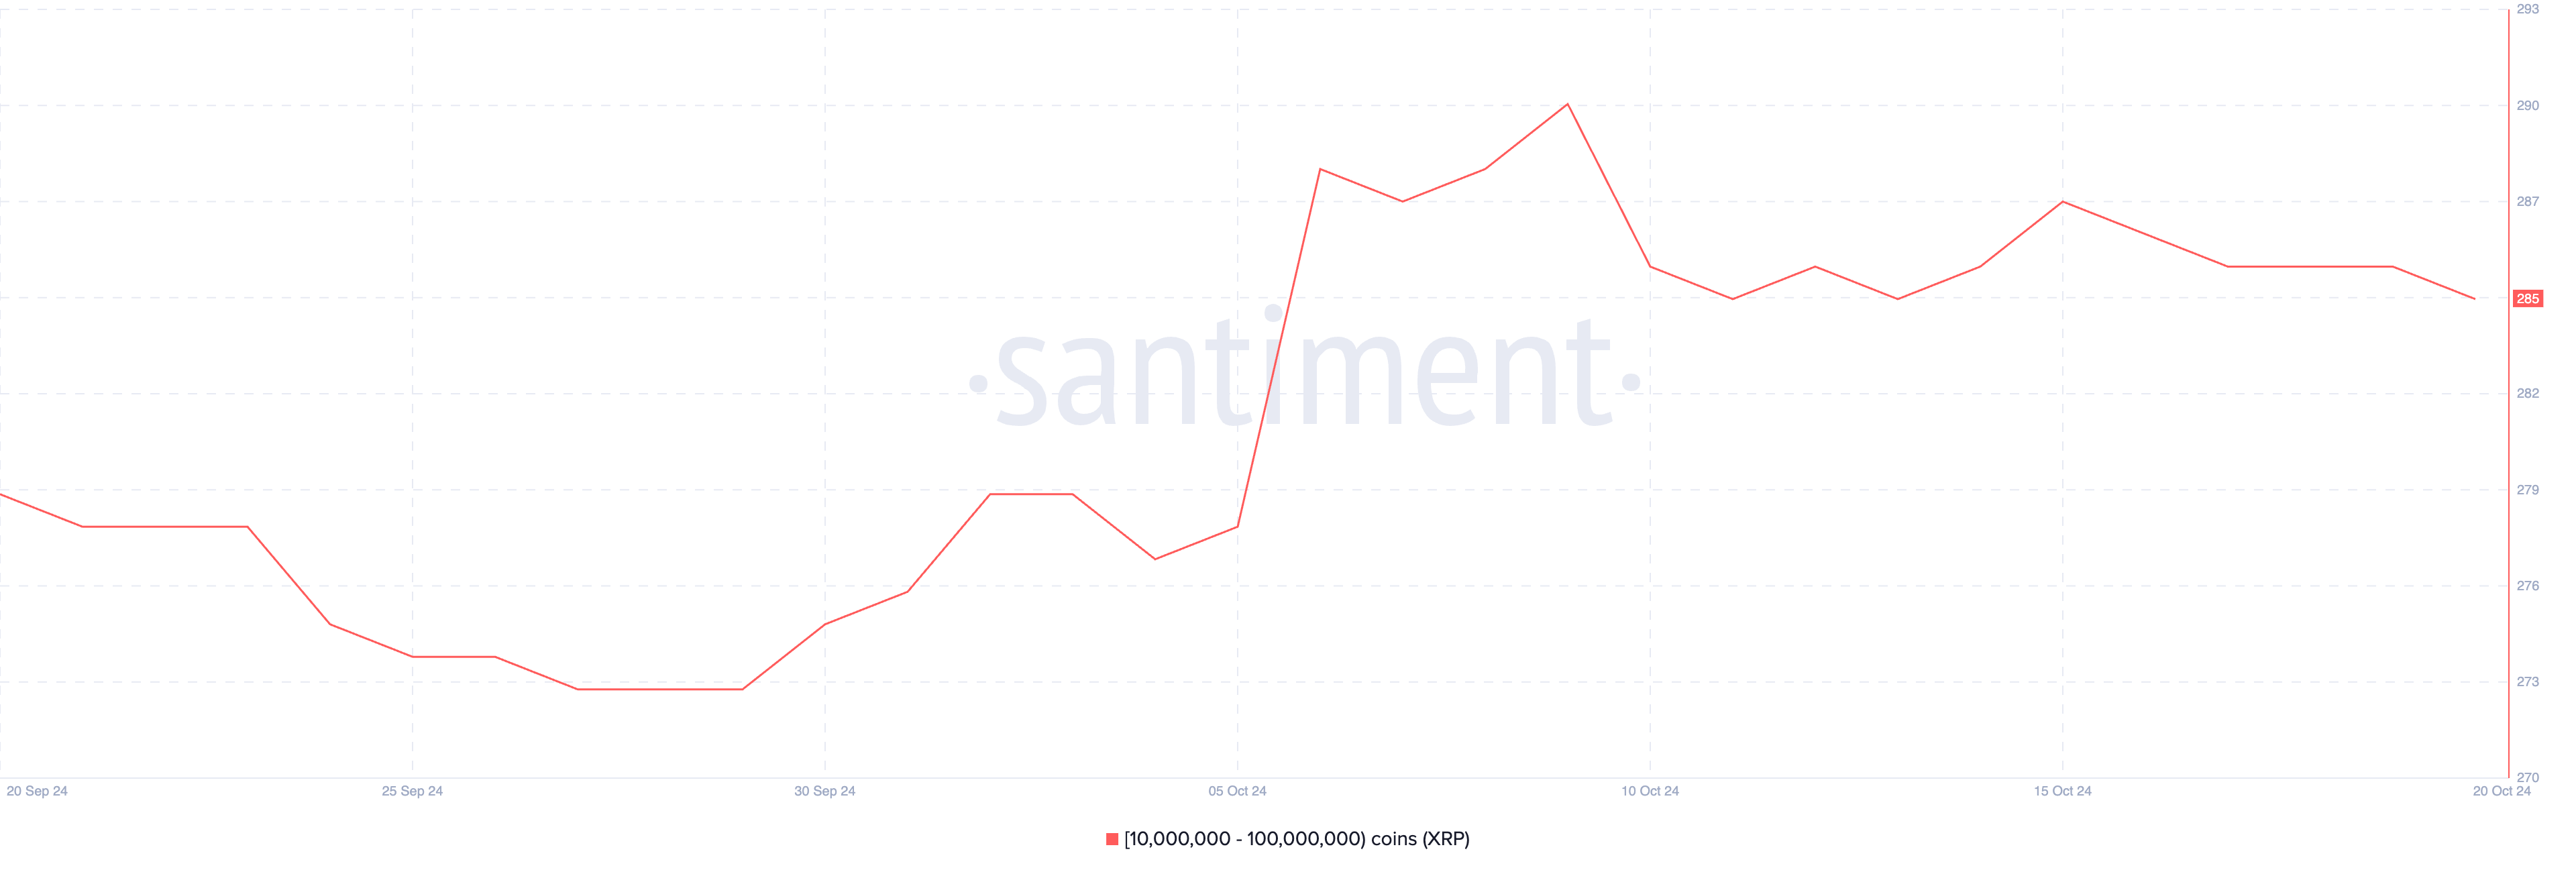
The number of wallets holding between 10 million and 100 million XRP has shown little fluctuation since October 9. Currently, there are 285 such wallets, and the count has remained within a narrow range of 284 to 287 over the past week.
This consistency suggests that these large holders, or “whales,” are taking a cautious stance and are not making significant moves either into or out of their positions.
Read more: Everything You Need To Know About Ripple vs SEC
This metric is crucial because whale activity often provides insights into market sentiment. Whales have the power to move markets, and their buying or selling decisions can be strong signals for upcoming trends.
The stable count of these large wallets implies that these major players are not yet convinced that XRP is ready for a significant price surge. Until whales start accumulating more aggressively, a strong upward move for XRP seems less likely.
Ripple’s DMI Shows a Potential Uptrend
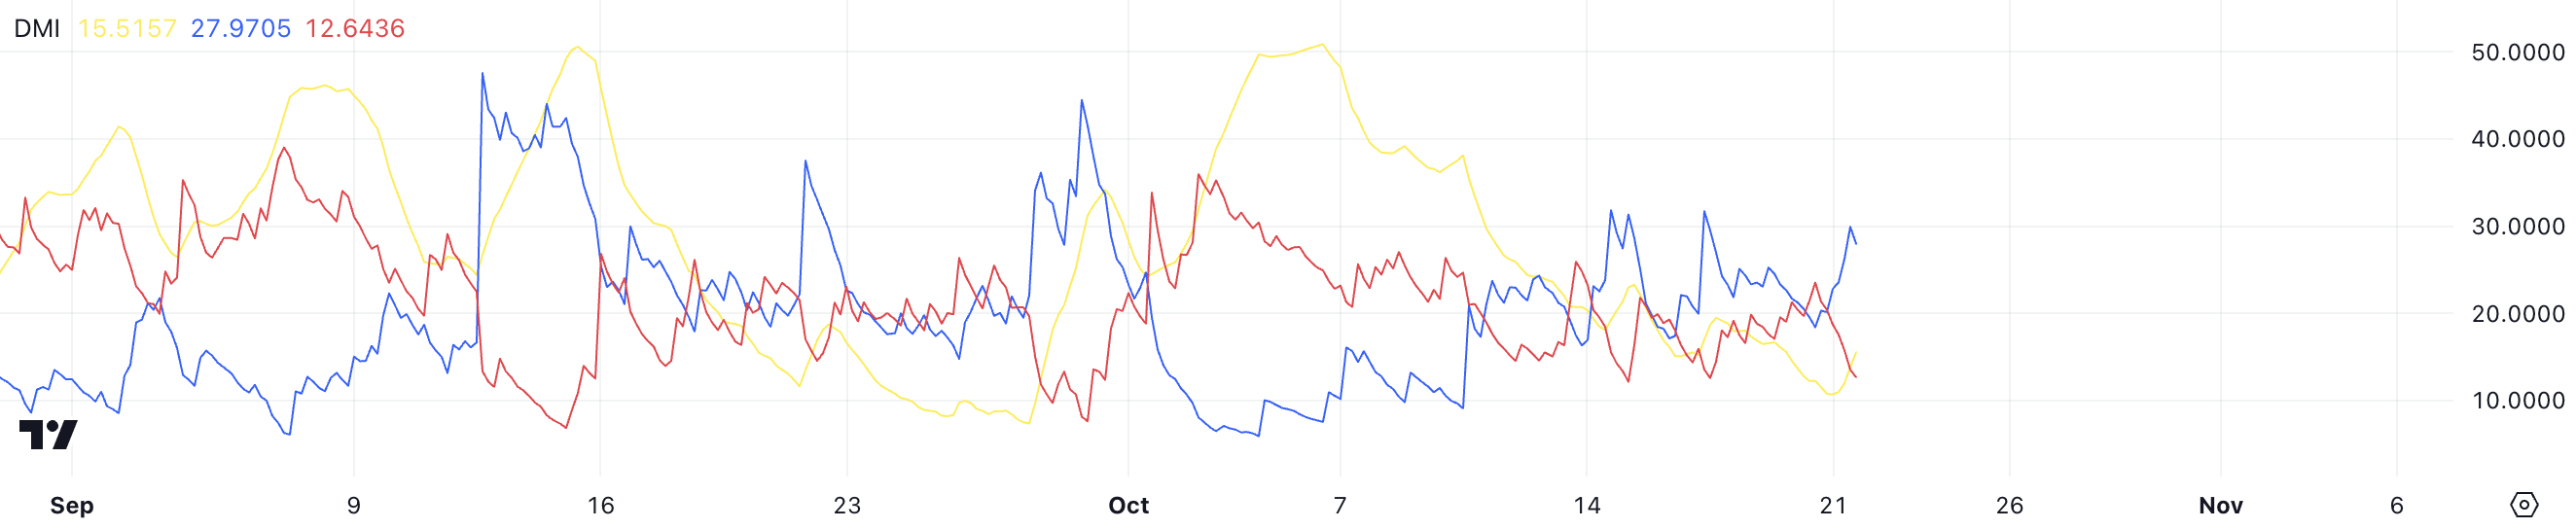
Ripple’s Directional Movement Index (DMI) chart currently shows the positive directional line (D+) at 27.9, the negative directional line (D-) at 12.6, and the ADX at 15.5. The higher D+ value compared to D- suggests that buying pressure is greater than selling pressure.
However, the ADX, which measures trend strength, is at a relatively low value, indicating that the trend is weak despite the buying momentum.
The DMI is a technical indicator used to determine both the direction and strength of a trend. It consists of the D+ and D- lines, which indicate buying and selling pressures, respectively, along with the ADX, which measures the overall strength of the trend.
The current setup shows that XRP’s price has been attempting to break above key resistance levels in recent days. However, for a successful breakout to occur, the uptrend needs to gain more strength, as indicated by a rising ADX.
XRP Price Prediction: Can It Get Back to $0.66 In October?
XRP’s EMA lines currently show a bearish setting, with the long-term line positioned above the short-term lines. However, the short-term lines are trending upwards, indicating potential bullish momentum.
If the short-term EMAs manage to cross above the long-term EMA, it could ignite a strong uptrend, reversing the current bearish sentiment.
Read more: Ripple (XRP) Price Prediction 2024/2025/2030
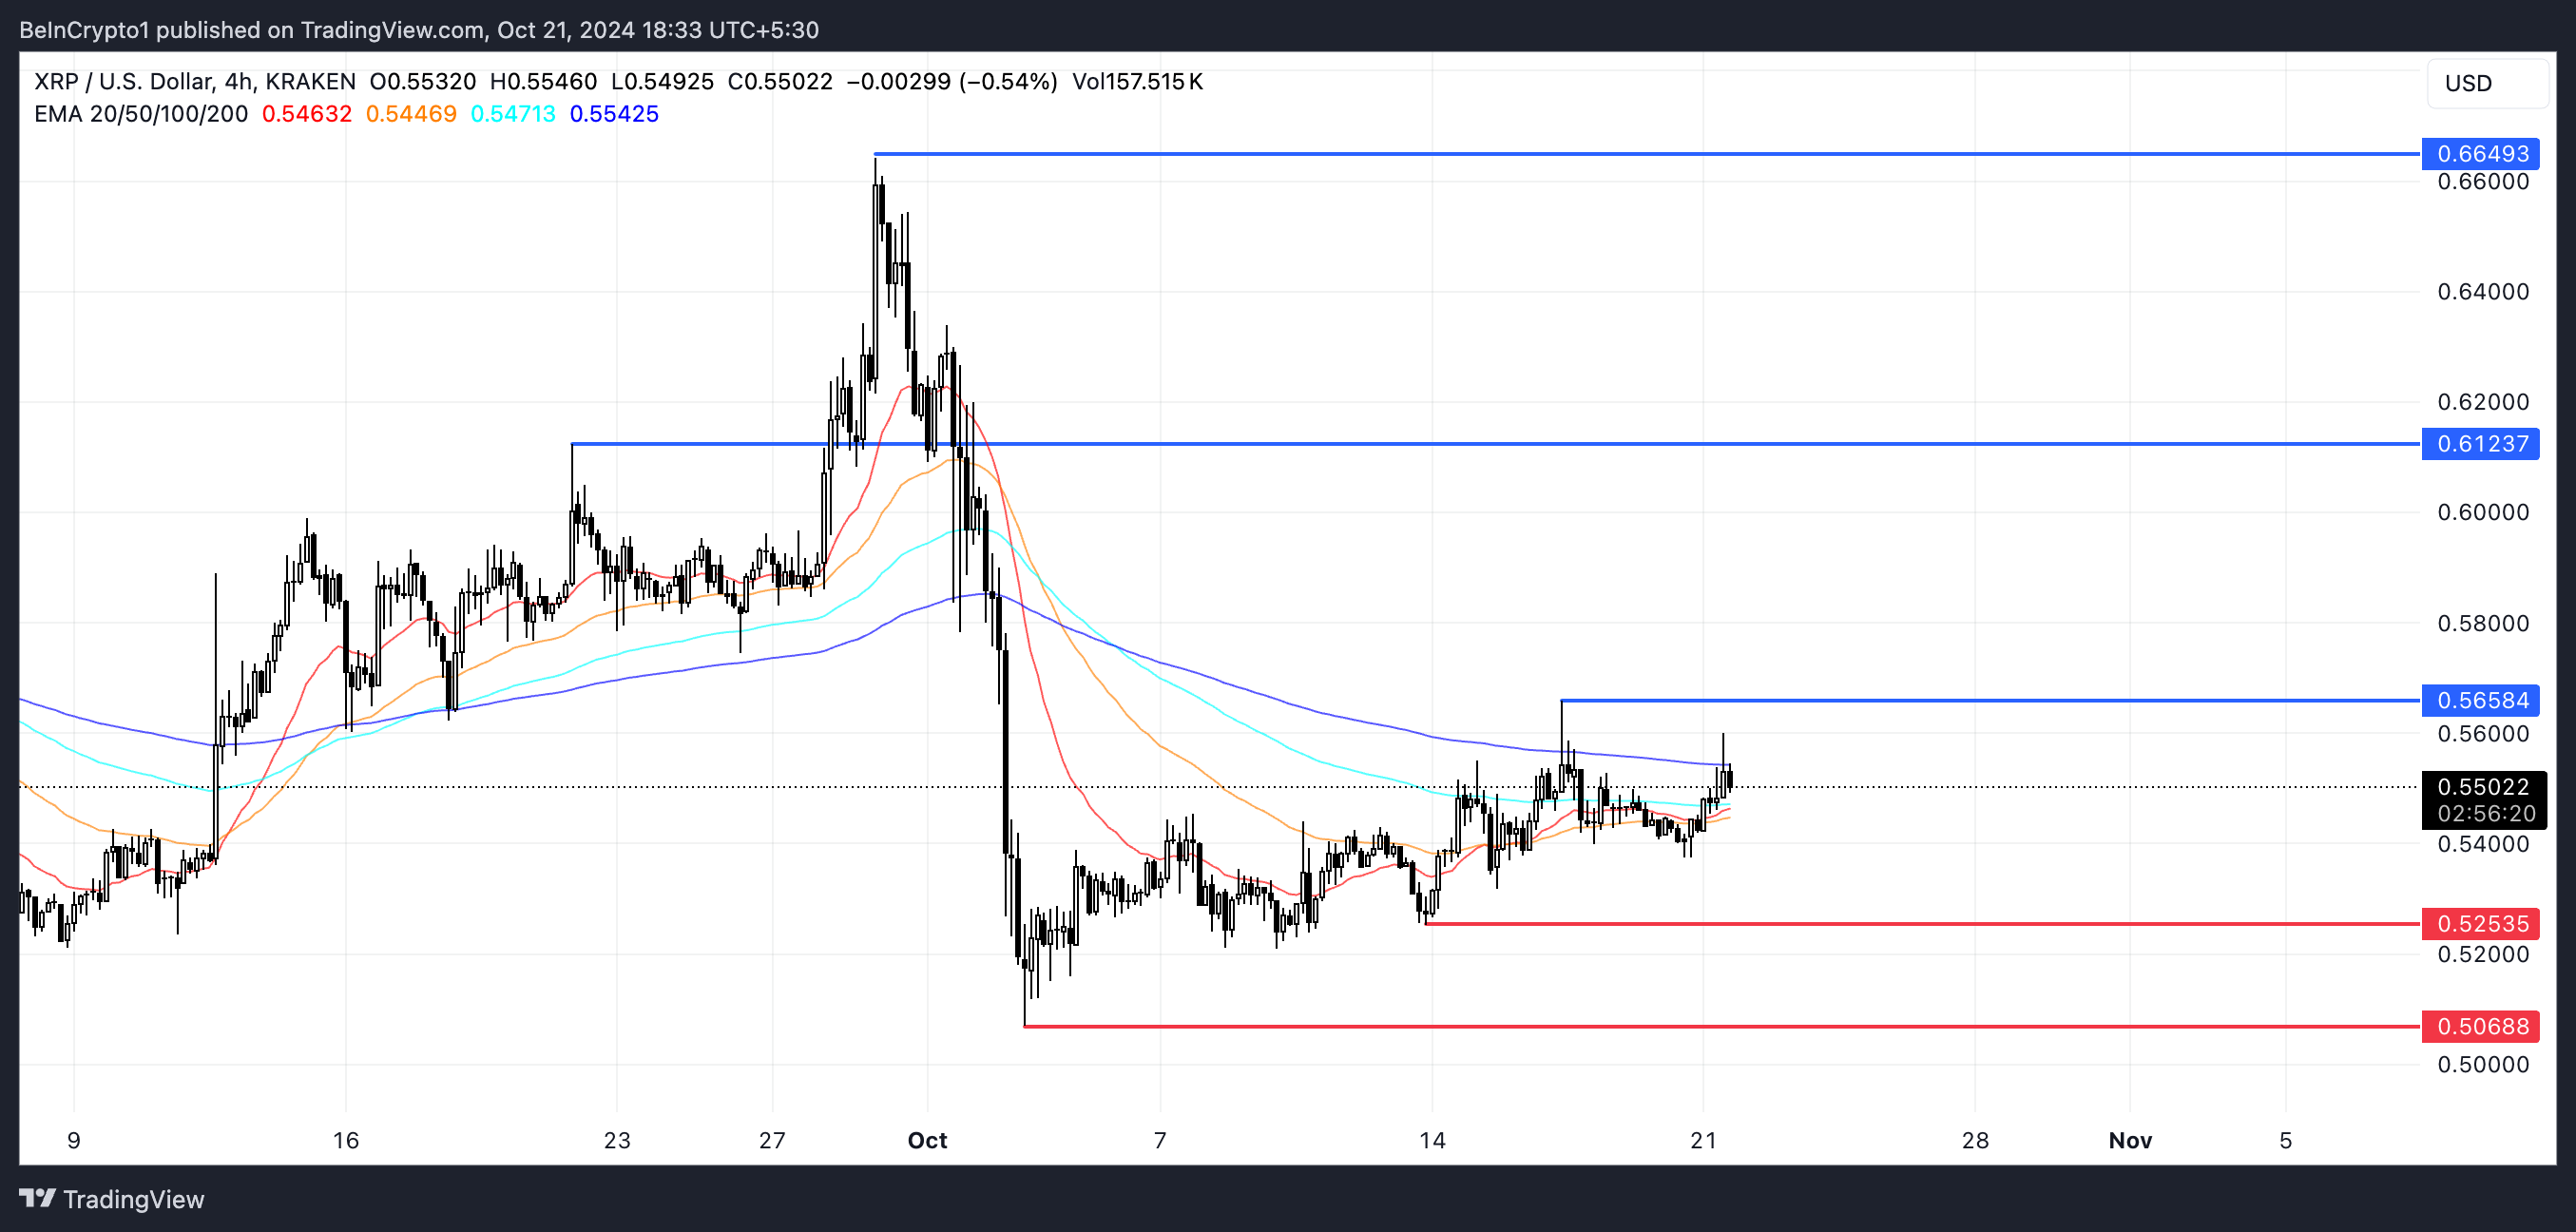
XRP is also facing significant resistance levels at $0.56 and $0.61. If these levels are broken, the price could climb to $0.66, which would represent a potential 20% increase.
Conversely, if the uptrend does not materialize and bearish momentum gains strength, XRP will likely test support levels at $0.52 and $0.50. This pivotal point will determine whether XRP breaks out to the upside or remains under pressure.