
Bonk ($BONK), a Solana-based memecoin, went sideways throughout the week, displaying indecision among traders. However, an uptrend in a key indicator suggests a bullish divergence is forming.
Meanwhile, $BONK price comfortably held gains above the key EMAs and attempted to breach the primary hurdle of $0.00002400.
The bullish conviction arose from the recent breakout observed on the chart. Last week, the memecoin breached a trendline barrier and decisively retested the region.
It was poised for a fresh higher high swing above $0.00002400 and could see a 20% upswing in the following sessions.
Directional Movement Index Points to Bullish Trend for $BONK
$BONK’s Directional Movement Index (DMI) shows a slightly bullish momentum. The +DI or positive DI is at 23.40, whereas the -DI or negative DI is at 8.80, indicating that the buying pressure has outpaced the selling pressure.

$BONK price was trading at $0.00002327, noting an intraday drop of over 1.11% and a weekly surge of around 10%.
The pair of $BONK/$BTC was trading at 0.000000000340 $BTC, and had a volume-to-market cap ratio of 0.0724.
With a market cap of $1.72 Billion, the memecoin was ranked 50th among the top 100 crypto coins.
$BONK Price Prediction: Is a 20% Rally Imminent?
On October 20, $BONK price traded above the key EMAs and formed a golden cross, a 20% surge is likely in the following days.
The 20-day EMA line has crossed the 50-day EMA on an upward side, signaling a bullish shift in momentum and indicating upward price movement in the following sessions.
Also, when the shorter EMA crosses above the longer one, it means that the short term bullish trend was intact.
In a recent tweet on X, cryptopunkrock said that $BONK crypto bounced from the 23.6% Fib level and witnessed accumulation.
A daily close above the descending trendline of $0.00002400 would give another crossover of 50-day and 200-day EMAs.
$BONK tested 0.235 FIB from the complete retracement and bounced. Next test to break desc. trend. #$BONK price pulled back so far. Hope to see another rise and daily closing green candle so that EMA50 will clearly cross 200 from below. pic.twitter.com/Wbi8NEk7Ei
— CPR (@cryptopunkrock1) October 19, 2024
The Relative Strength Index (RSI) line stayed above the midline region, around 56 at press time, forming a positive divergence, signaling a bullish outlook.
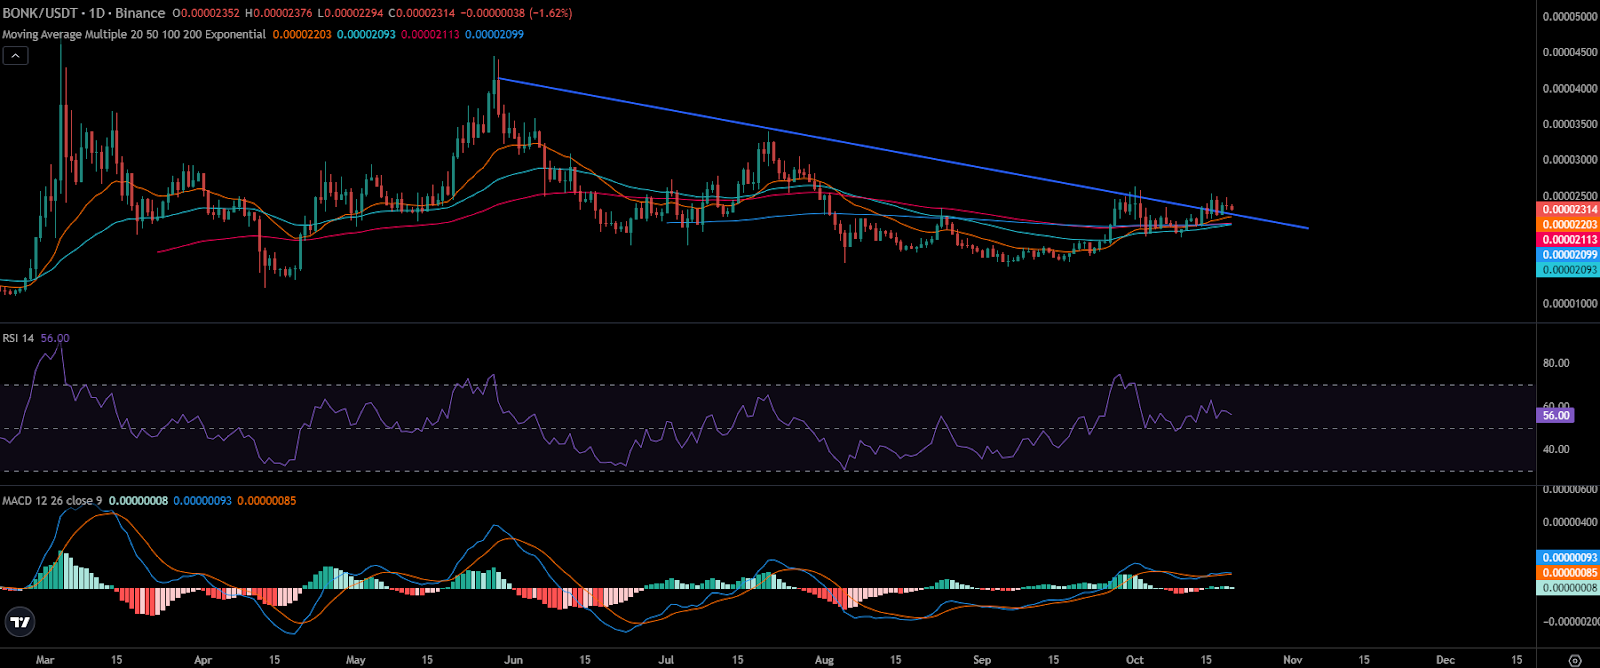
The Moving Average Convergence Divergence (MACD) indicator signaled bullishness; the MACD line stayed above the signal line, conveying a positive stance.
Long or Short? Data Shows Mixed Cues
Data from Coinglass indicates that the Netflow graph displayed mixed cues. Looking at the direction of NetFlow, it is clear that more traders are withdrawing their $BONK from exchanges, indicating a positive stance.
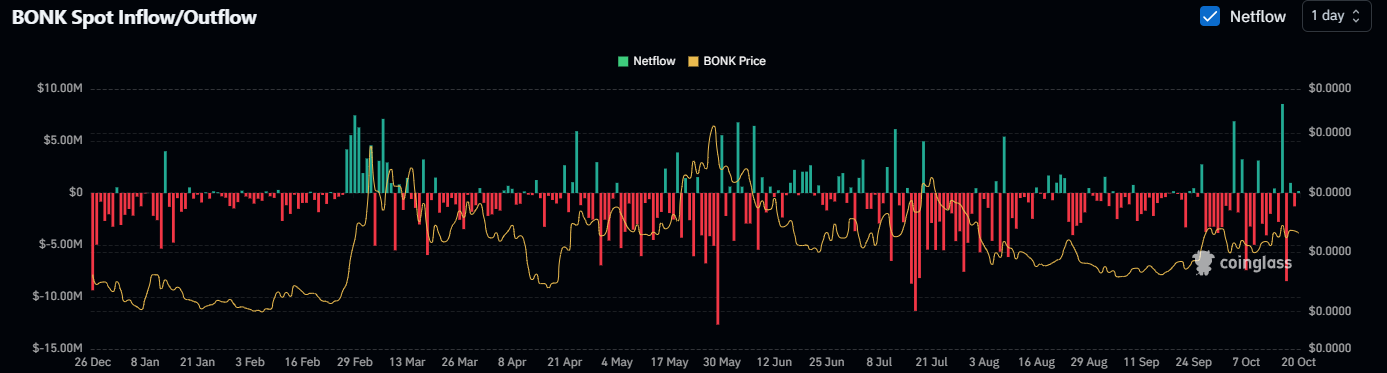
Over the last seven days, traders have withdrawn over $4.10 Million worth of $BONK from Binance and $1.03 Million from Bybit. However, the long/short ratio was at 0.9444, favouring the long side trades.
Meanwhile, the Open Interest (OI) has dropped over 3.20% to $8.31 Million, which signifies a minor long unwinding move over the past 24 hours.