
Beam ($BEAM) crypto could be on the verge of a significant breakout rally despite the recent bounce to $0.01700. Several indicators suggested this significant conviction by analyzing on-chain.
The $BEAM crypto traded close to the 200-day EMA resistance barrier and has witnessed accumulation on the chart. The price has surged by over 25% in the last two weeks. It anticipates a breakout shortly.
The 30-day Market Value To Realised Value (MVRV) ratio has recently spiked above 7. It assesses the profit or loss status of those who have bought $BEAM in the last month. This indicated that holders who have bought $BEAM in the previous few sessions experienced a profit exceeding 7%.
Accumulation Ramps Up: $BEAM Crypto Presents a Rare Buying Opportunity
The analysis of $BEAM crypto on a daily time frame chart provides a bullish bias. $BEAM price initially experienced a weekly surge of over 13.20%, trading at $0.01755 at press time.
With a market cap of $867.92 Million, the altcoin was ranked at 78th position. It had a total supply of 62.43 Billion. Data from IntoTheBlock revealed that $BEAM’s Network Value to Transaction Value (NVT) has surged to the 123 mark.
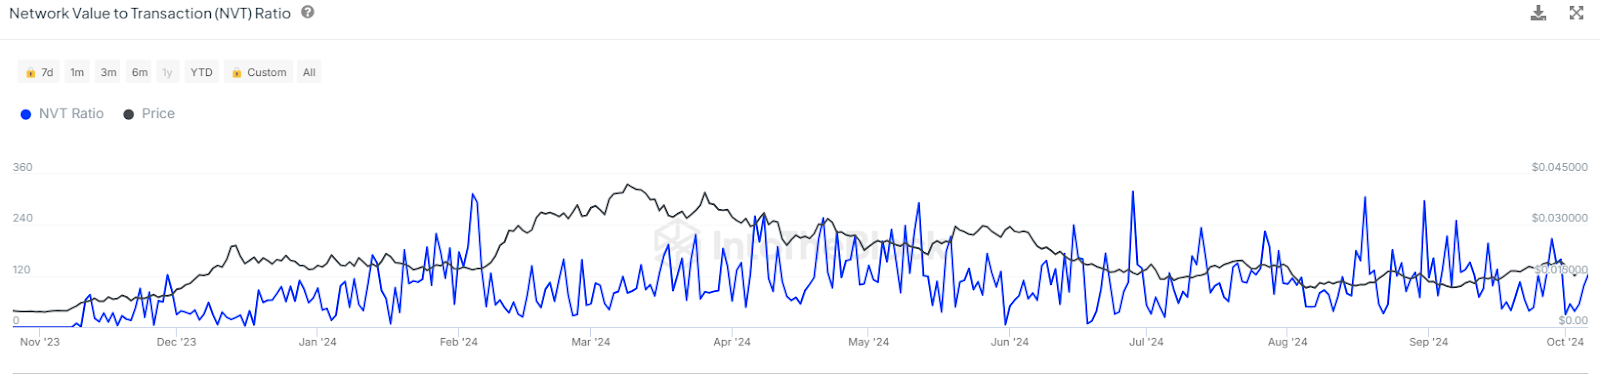
Typically, values above the 100 mark indicate that accumulating $BEAM at the current price offers a better risk to reward. It has rebounded from the undervalued zone.
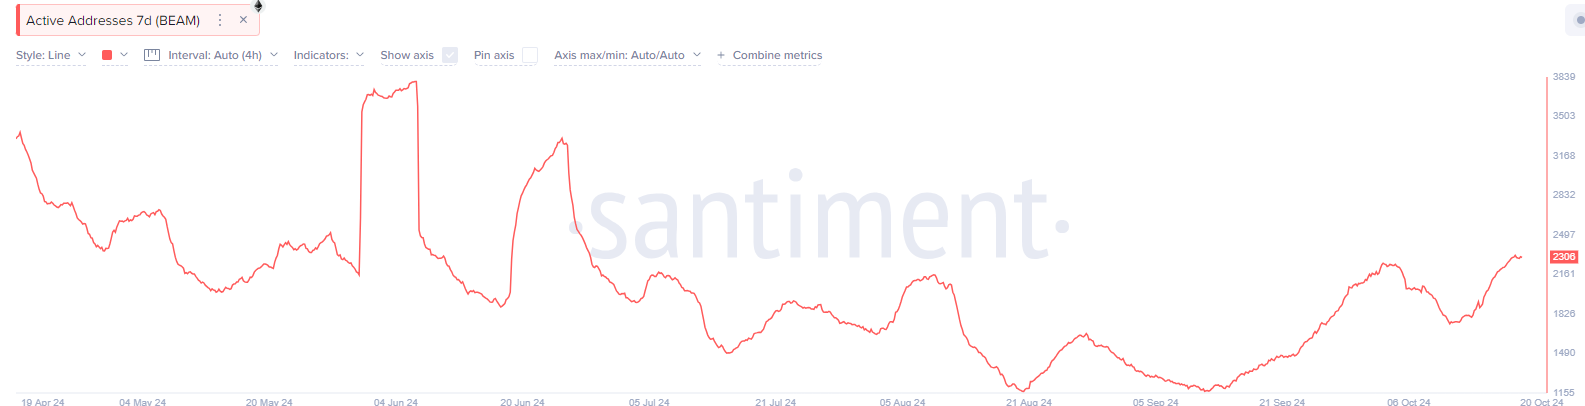
Over the past seven days, the active addresses data also witnessed a significant pump. It has risen to 2306, a 15% rise, implying that the $BEAM token is in demand.
However, $BEAM’s Sharpe Ratio stayed around the 1.17 mark. This highlighted that the altcoin has room to go upward and offers a rare chance to buy at current price levels.
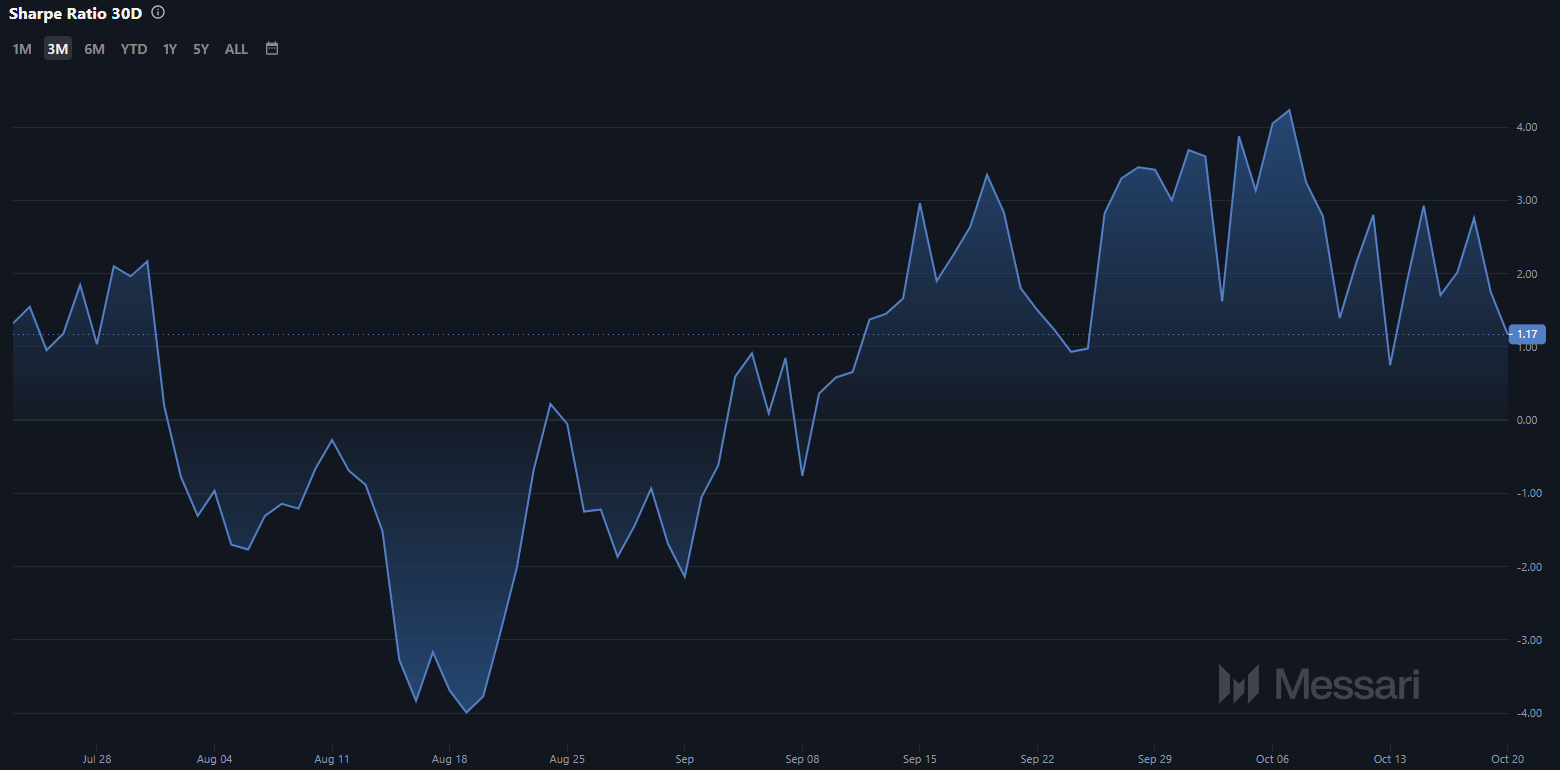
$BEAM crypto was trying to shift the gains above the 200-day EMA for a significant upswing ahead.
What Do Technical Indicators Suggest?
$BEAM price traded above the 20-day, 50-day, and 100-day EMA mark. This guided a short-term bullish trend. In a recent tweet on X, Godelives said that $BEAM crypto‘s long-term bullish trend was intact. It is one of the best memecoins. It could give 20x gains easily in the near term.
Everyone wants to hit a homerun with the right meme and yes they will print but $beam is still the easiest 20x. pic.twitter.com/Aku99fehdC
— Gödel 🥃🌈↗️ (@godeLives) October 18, 2024
The Relative Strength Index (RSI) line stayed around 58, conveying a slightly bullish overview. It reflected a positive divergence and suggests a significant bullish trend ahead.
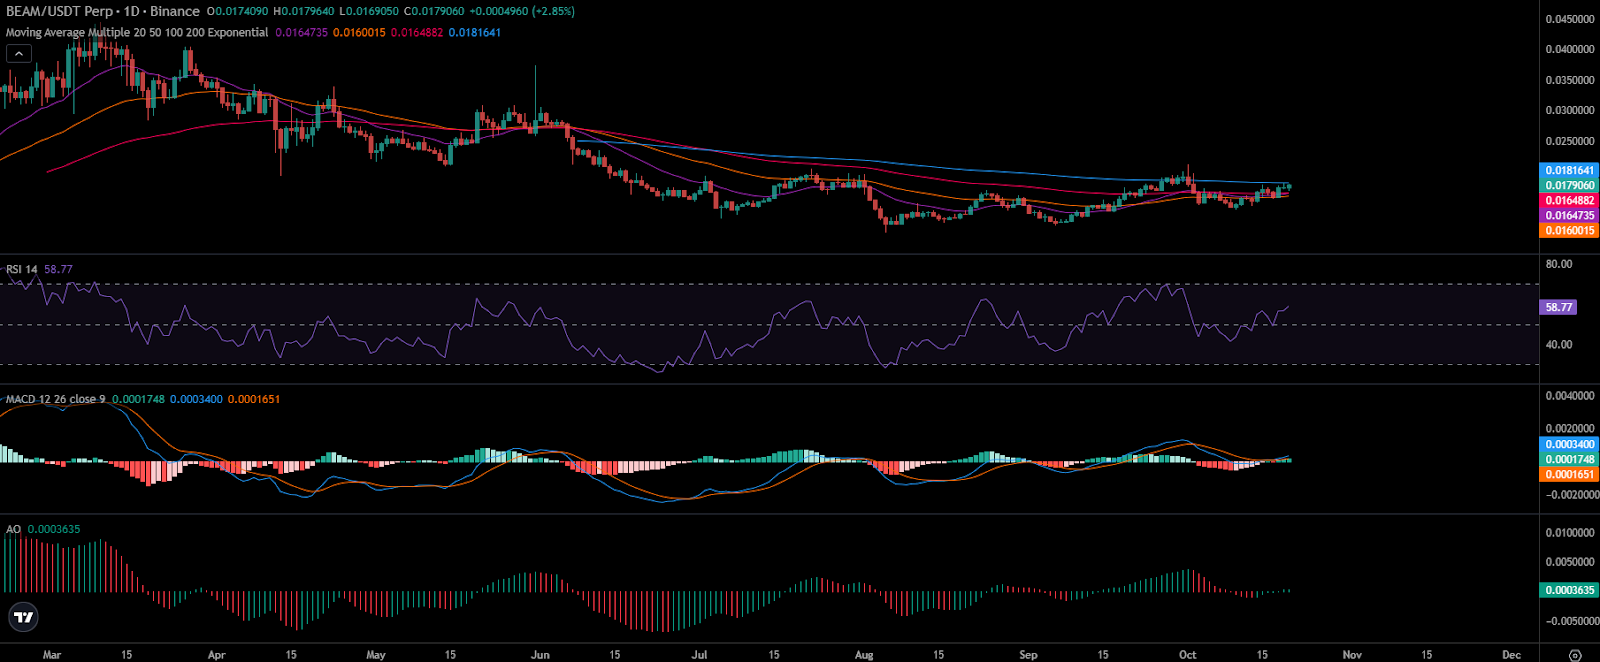
Moreover, the Awesome Oscillator (AO) reading was positive at 0.036. This implied a bullish momentum was emerging.
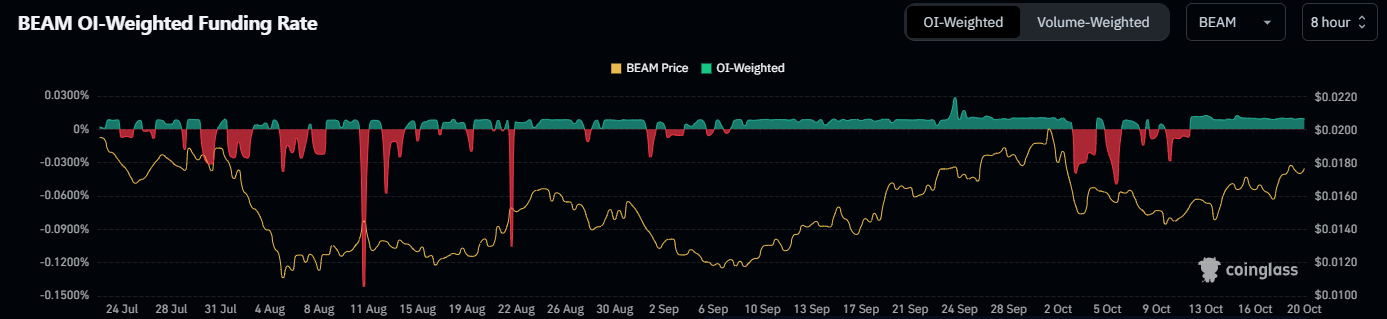
Additionally, the Moving Average Convergence Divergence (MACD) indicator plotted bullish histogram readings. This confirmed the buyer accumulation. The futures market data showed that the OI-weighted funding rate remained positive, around 0.0097% at press time.
However, the Open Interest (OI) dropped over 3.40% to $11.36 Million. It conveyed a long, unwinding move over the past 24 hours. The immediate support zones for $BEAM were $0.01700 and $0.01630. On the other hand, the upside hurdles were $0.01830 and $0.01940.