
The price of the Base-based memecoin Brett ($BRETT) surged by 8% in the past seven days. It has surpassed the horizontal neckline of $0.1000 and reached two months’ highest trajectory. $BRETT price could gain more upside as it recorded a falling wedge pattern breakout this week.
Additionally, it has climbed above the key EMAs and guides a bullish bias. This contrast suggested that the selling pressure might end, potentially setting the stage for a bullish trend.
Additionally, investors’ behavior suggested that $BRETT crypto will regain bullishness and may retain the $ATH region soon. Since the beginning of October, $BRETT crypto has witnessed buyer accumulation from the lower levels. It has surged over 38% in the last 20 days.
$BRETT Price Sees Bullish Signals: Is a Rally Imminent?
The $BRETT price reached a monthly high of $0.1052, noting a weekly surge of over 8.20%. With the rising positive developments, the token continued to gain investor interest. The bullish trend was intact, and the memecoin displayed significant whale accumulation.
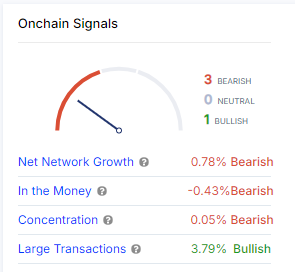
Large transactions noted a surge of over 3.79%, which gave a bullish conviction. Bulloro is a crypto analyst. In a recent tweet on X, he said the $BRETT token has broken out of the inverse head and shoulders pattern.
This happened after retesting the 20-day EMA mark. It may approach its $ATH region by November and display bullish cues.
$BRETT is about to make the most explosive move upwards.
— Bulloro (@bullorochanel) October 18, 2024
We have broken out of the Inverted Head and Shoulders pattern, we have completed the retest, and now we are heading towards a New $ATH.
I'm expecting this to happen in November as the elections approach.
🔜 $80B $BRETT pic.twitter.com/LKuxiI0HnC
Further, the 50% Fib level was positioned at $0.1080, which could be a good entry to go long. A daily close above $0.1220 would trigger further upside. It may soon revisit the $ATH mark of $0.1939.
On-Chain Data and Technical Indicators Support Bullish Trend
As of this writing, the MACD reading was positive. Also, the $BRETT price was positioned above the key EMAs, which supported the bounce. The Relative Strength Index (RSI) line stayed above the midline region, 59 at press time, giving bullish cues.
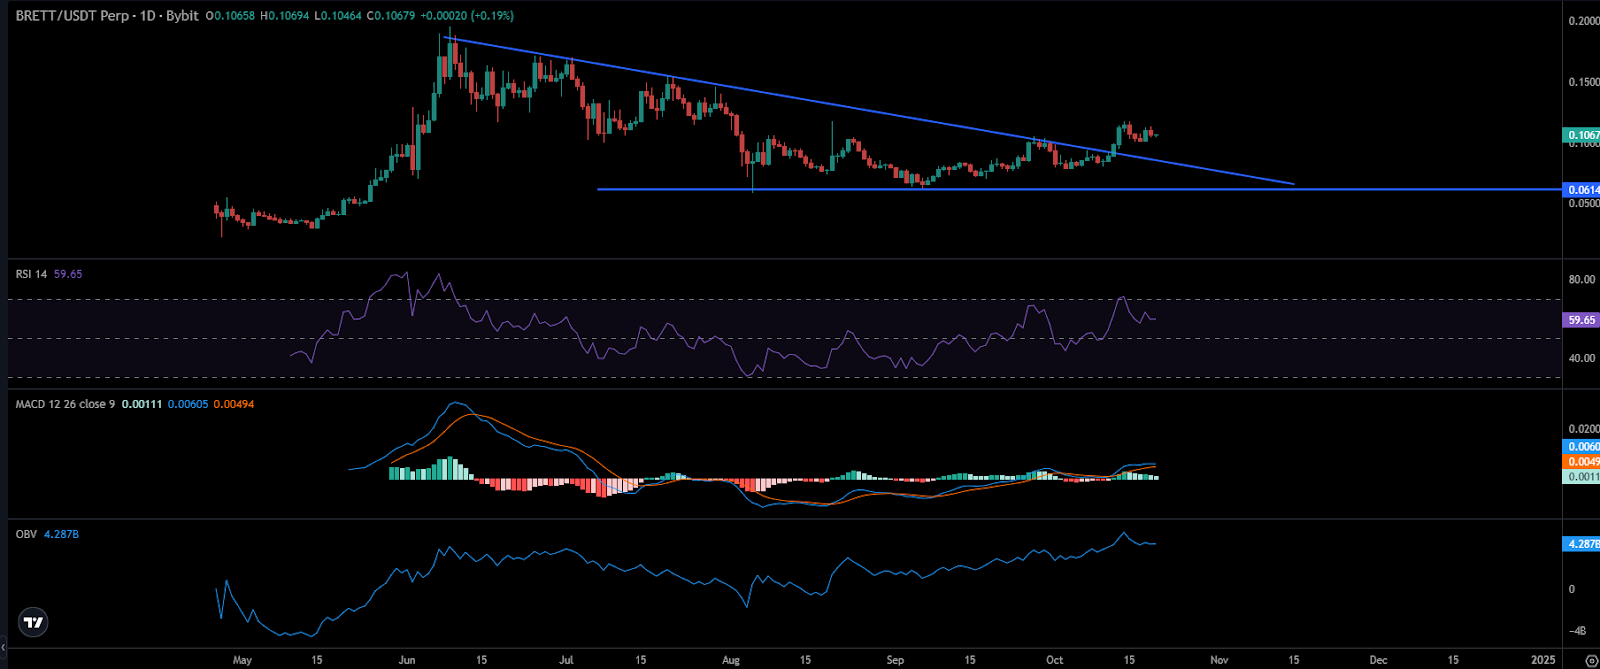
Additionally, the On-Balance-Volume (OBV) displayed a spike to 4.212 Billion, noting significant accumulation. Considering this indicator’s view, buyers had outpaced the sellers. The price action indicates that the memecoin has formed a series of higher highs and witnessed bullish momentum.
Furthermore, the media buzz was favoring the rise. According to Messari’s data, users were speculating about the $BRETT token on the X platform.
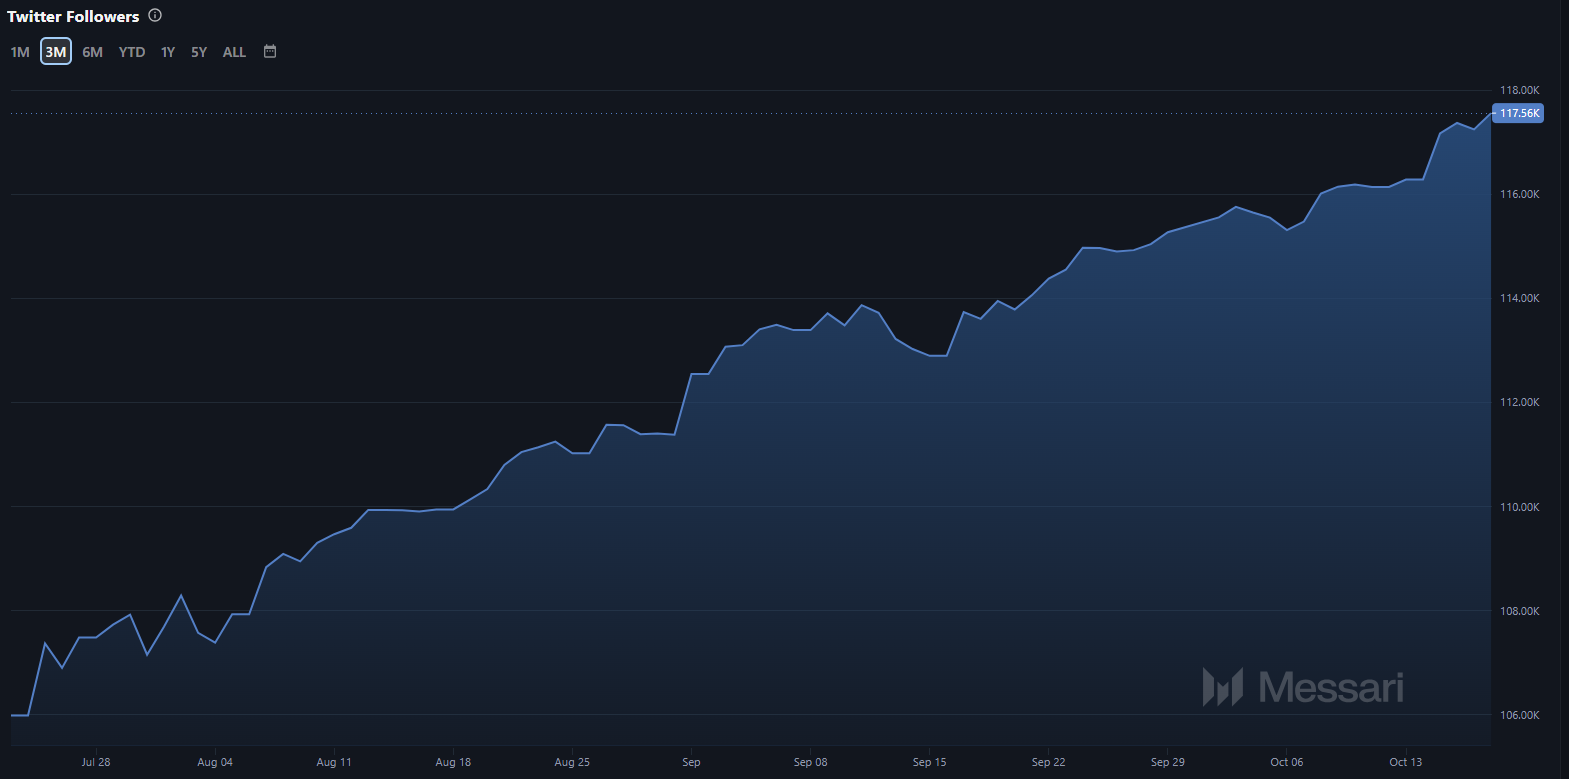
For the last three months, the count of followers recorded a massive spike. The number of followers on X reached 117.56k, witnessing significant growth.
Likewise, the OI-weighted funding rate remained positive for the past four weeks, 0.0092% at press time. This positive rate signified the sustained demand for the long positions.
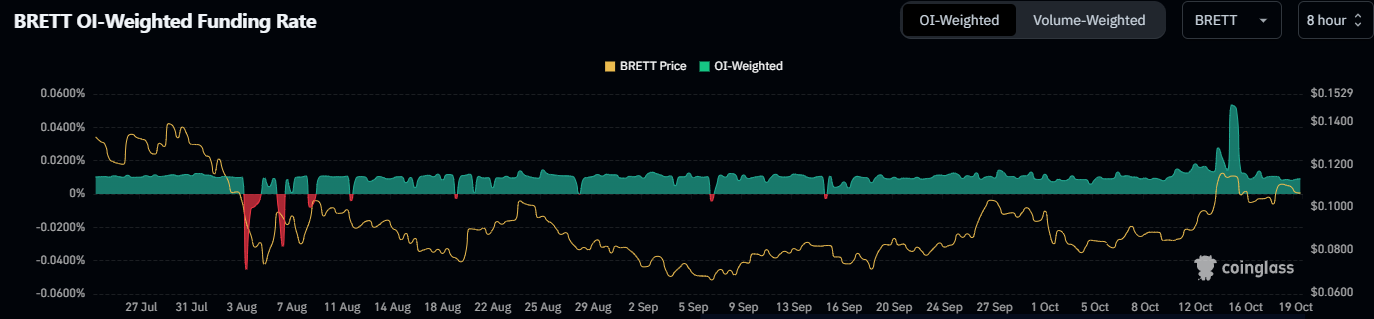
The long/short ratio was noted to be around 0.8804, slightly favoring the rise. Short positions have been covered in the past sessions. The immediate support zones for $BRETT crypto were $0.09970 and $0.09910. At the same time, the upside hurdles were $0.1120 and $0.1230.