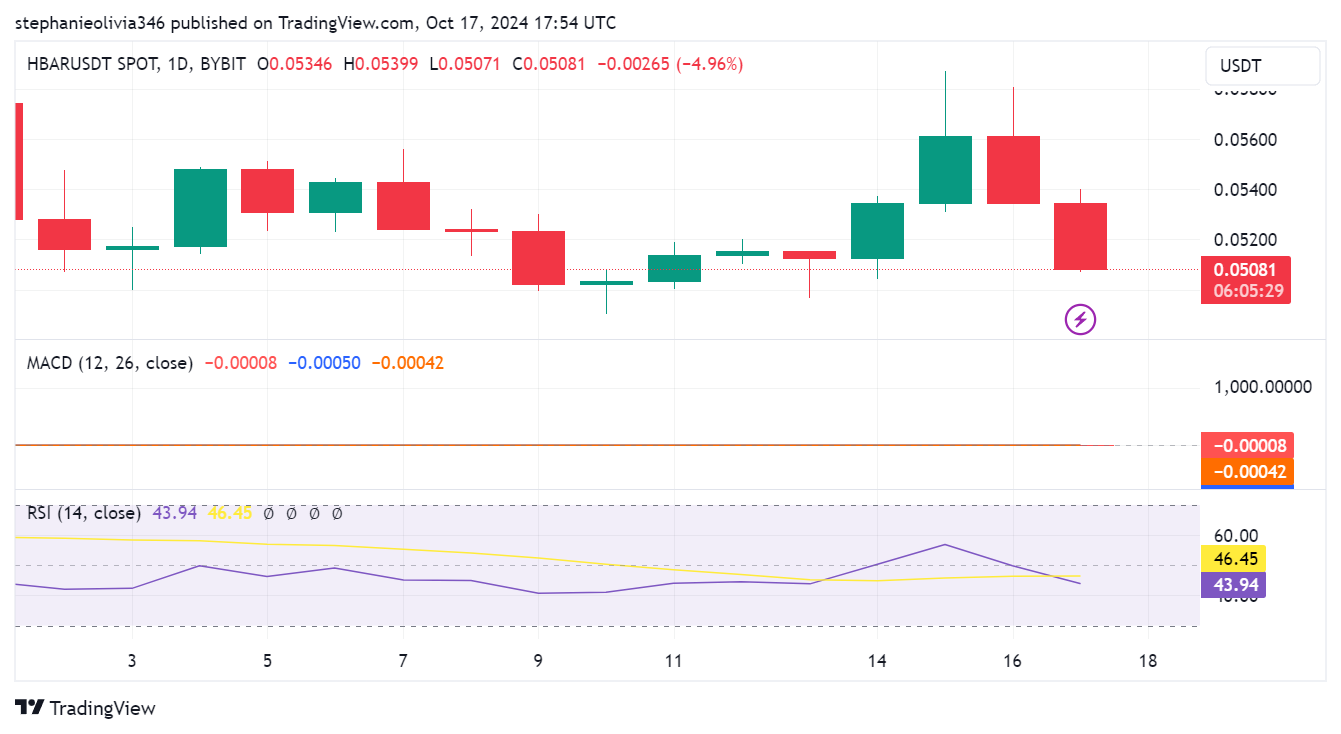
HBAR price action looks indecisive on the charts, but analysts hold out a positive outlook for the crypto. At the time of writing, Hereda Hashagraph (HBAR) was trading at $0.05081, down 4.96% in the last 24 hours.

HBAR went as high as $0.05399 but retracted after suggesting a bearish sentiment. Technical indicators suggest that further downside risk will be present if the current support levels fail to hold.
Technical Indicators Signal Bearish Sentiment
The price action of HBAR is alternating green and red candles, which signals indecision. The price remains within a narrow range of $0.051 and $0.054 without a clear direction. Additional downside pressure could follow if the price breaks below $0.050.
The MACD indicator shows the MACD line of -0.00008 and the signal line of -0.00042 below zero. The relative strength index (RSI) is 43.94, which indicates that the market bears are starting to take control.
Analysts See Potential Breakout if Key Resistance is Overcome
According to analyst Maverick, a breakout above $0.0559 represents a bullish reversal. “HBAR is testing key resistance at $0.0559, and a breakout could offer a solid entry opportunity,” he noted. If it goes above this level, it can rise rapidly towards previous highs.
$HBAR: Bullish Breakout on the Horizon?
— Maverick (@degen_maverick) October 16, 2024
After a prolonged downtrend, $HBAR is showing signs of strength.
🔹Holding above the 24h moving average, now testing key resistance at $0.0559.
🔹A breakout above $0.0559 could signal a solid entry opportunity.
🔹Market maker… pic.twitter.com/oW11RD3BMJ
Key resistance levels to watch for HBAR are around $0.07 and $0.10. A failure to hold these could lead to a test of support near $0.050.
Fibonacci Levels Provide Key Insights for Future Movements
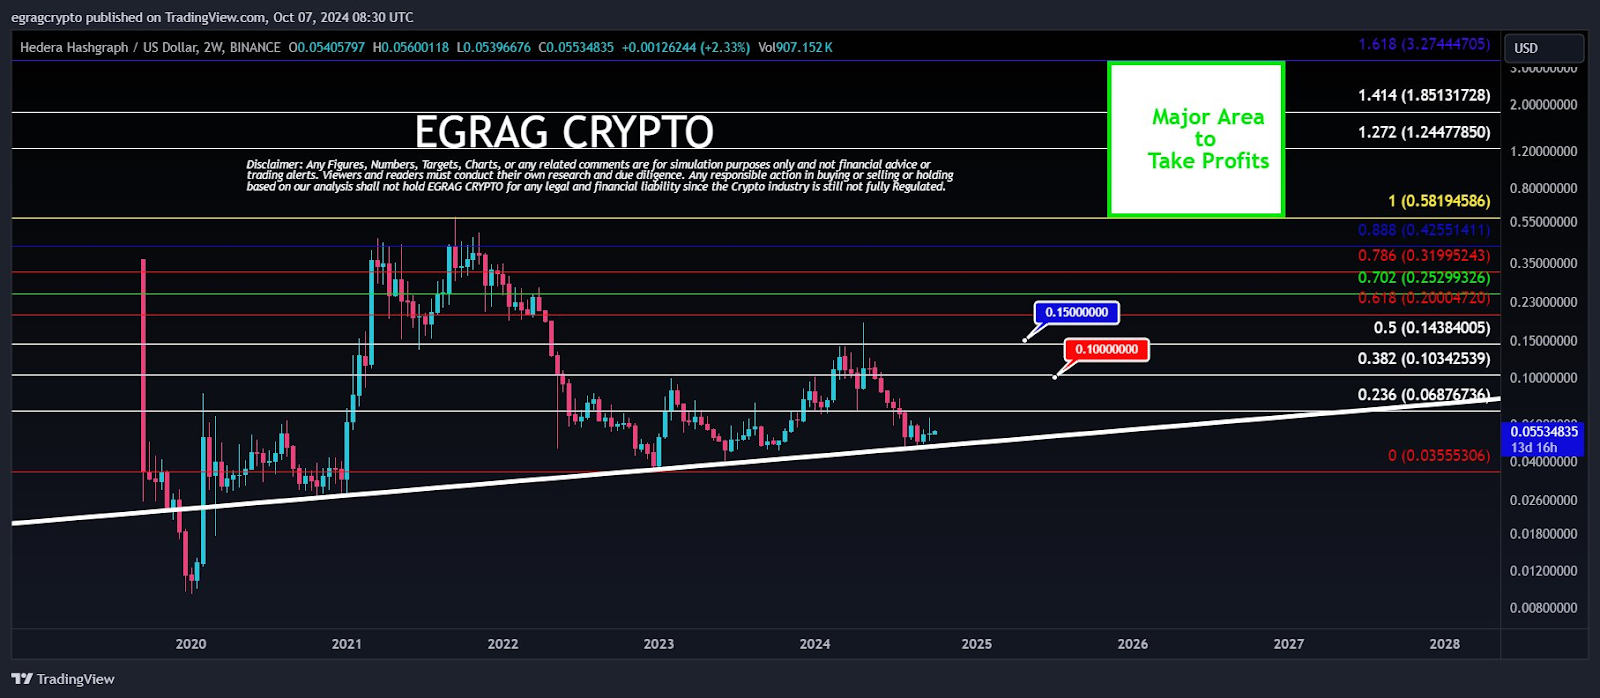
Technical analysis using Fibonacci retracement levels identifies key areas for HBAR. The 0.236 level at $0.0687 is crucial support, with major resistance at the 0.5 level near $0.15. A break above could ignite bullish momentum.

#HBAR MINIMUM 30X Potential (UPDATE): 🚨
— EGRAG CRYPTO (@egragcrypto) October 7, 2024
Last cycle, #ADA skyrocketed a mind-blowing 17,000%! 😱 To put this into perspective, with #HBAR's bottom at 0.036c, a 170X move would take it to around $6! That’s why I’m all-in on #HBAR! 💎 Backed by a powerhouse Governing Council,… pic.twitter.com/ysvPiHUSYR
HBAR consolidated below 0.236, and EGRAG CRYPTO stated, “HBAR is locked and loaded for a surge to Fib 0.702 at $0.25.” According to the analyst, until it surpasses the 0.5 level, “everything else is noise.”
Further upside projections suggest price targets between $1.24 and $3.27, based on Fibonacci extensions. However, the long-term outlook is bullish if HBAR fails to break past these key levels.
Analyst EGRAD CRYPTO stated that it has the potential for a 30x increase according to the previous market cycle. The analyst added that ADA skyrocketed a mind-blowing 17,000% last cycle, and HBAR is more likely to see similar gains.
 thecoinrepublic.com