Ripple’s price has once again disappointed investors, as the market crashed just when it began a seemingly new bull run.
XRP Price Analysis
By Edris Derakhshi (TradingRage)
The USDT Paired Chart
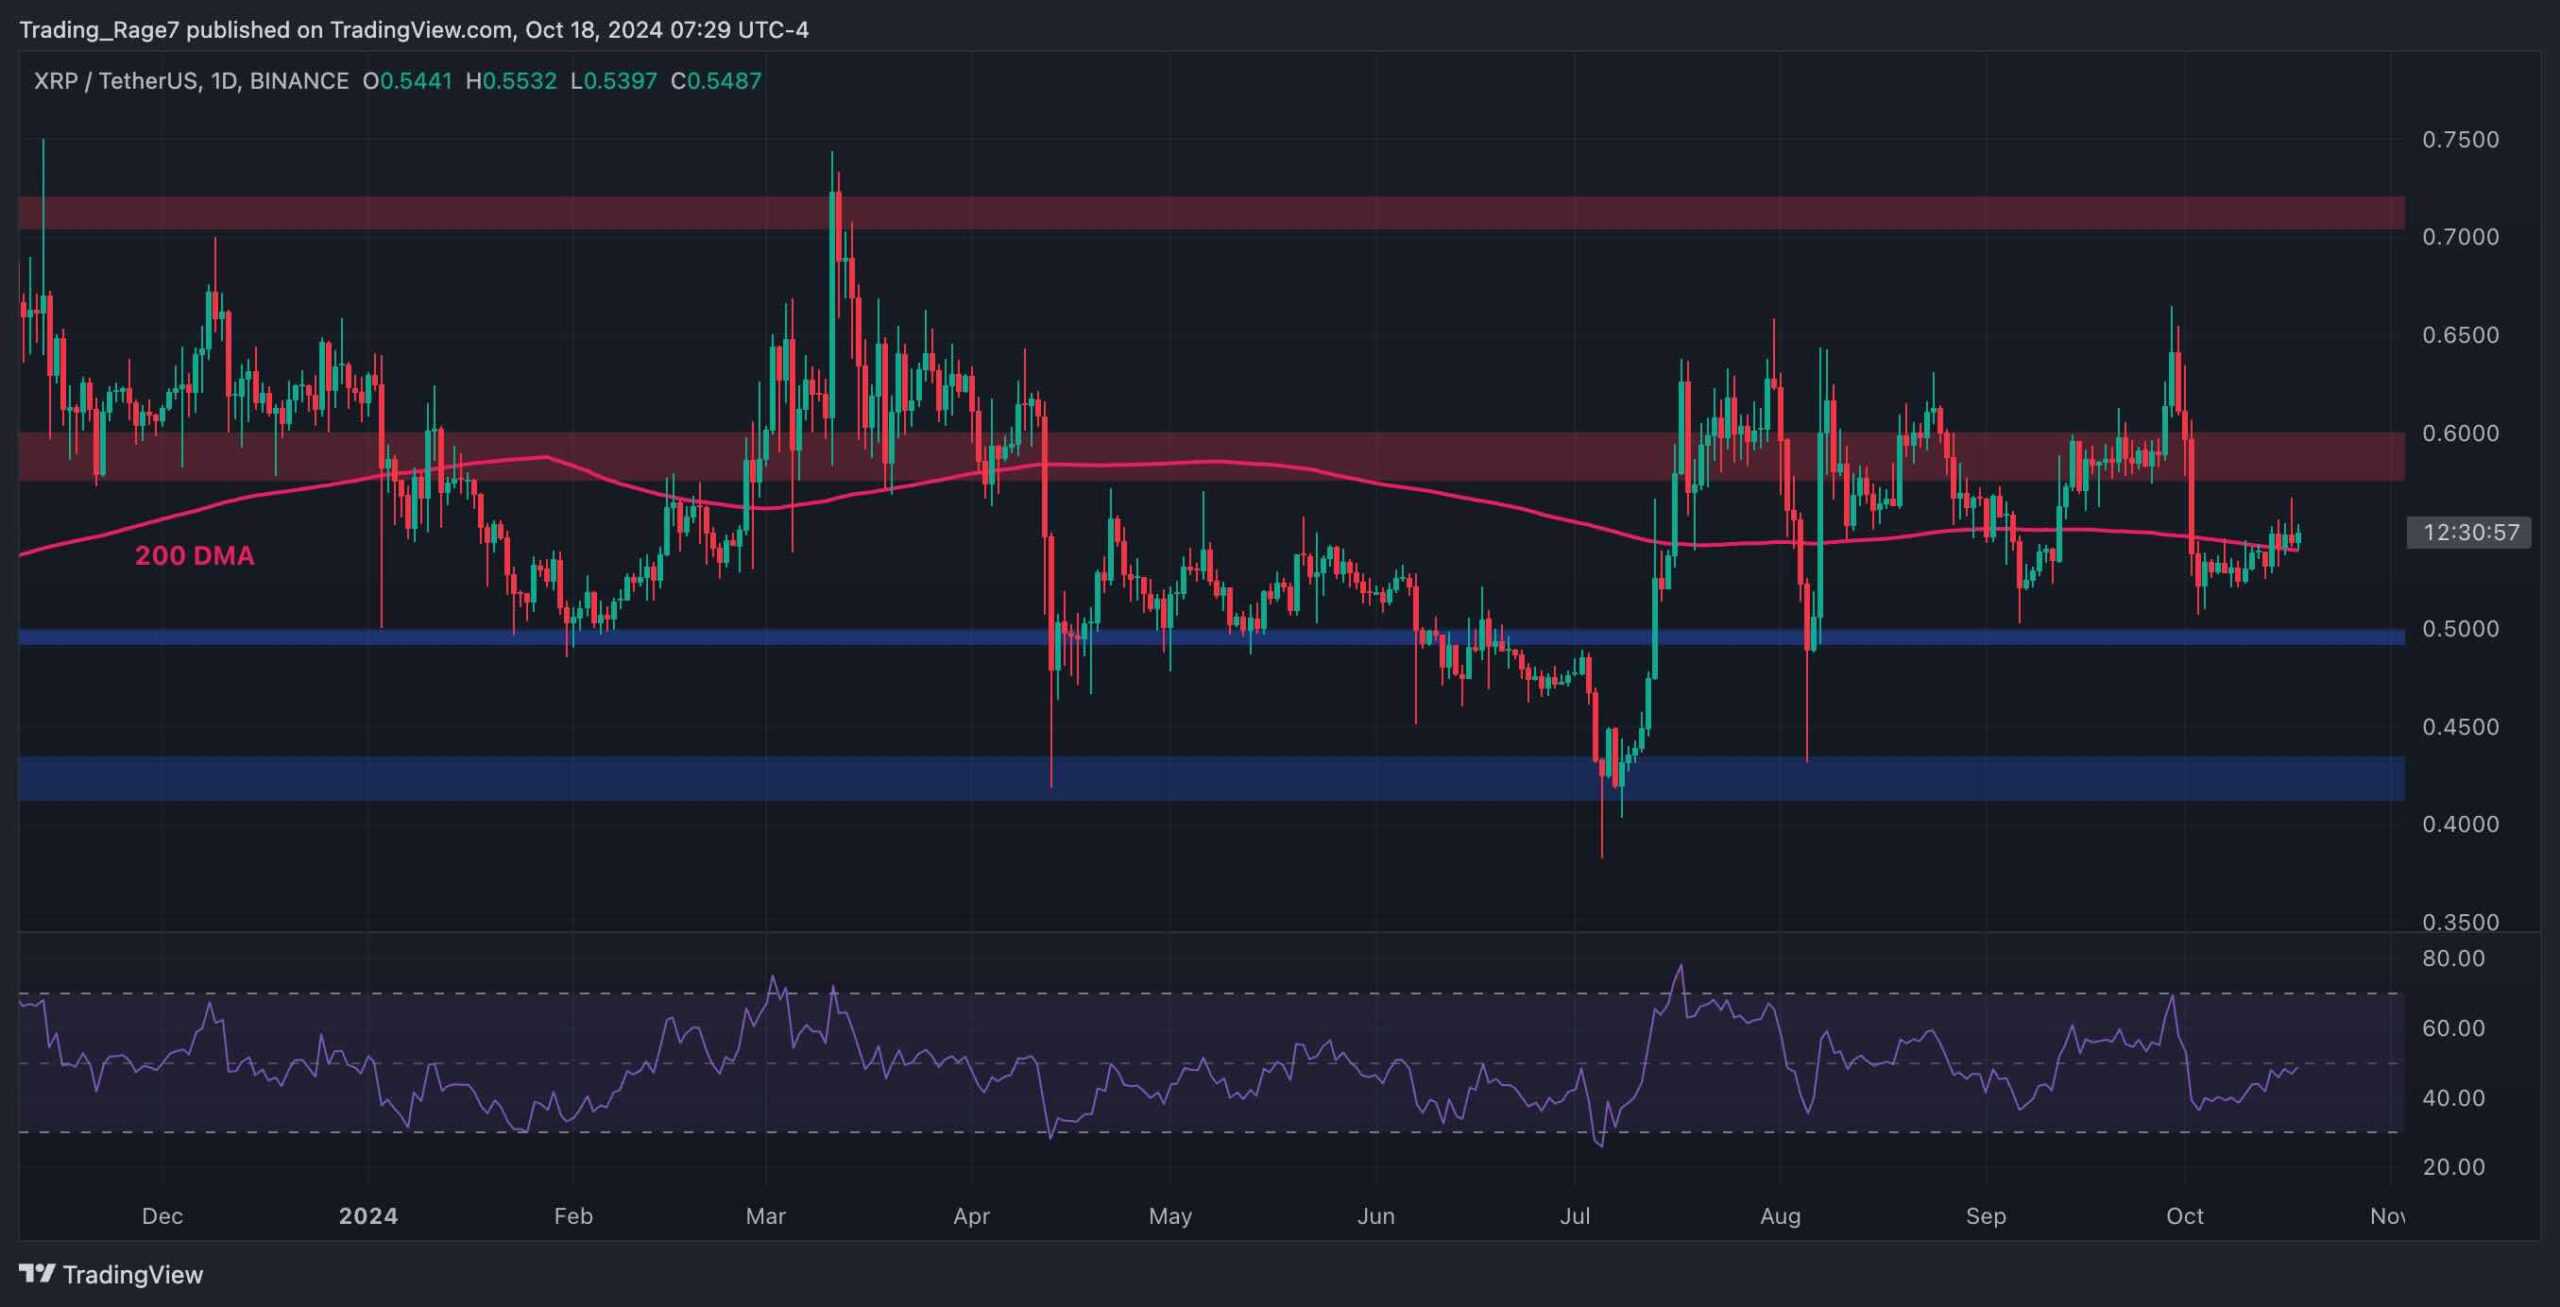
Against USDT, XRP has failed to stay above the $0.6 level, and it has also broken below the 200-day moving average following an unexpected crash.
The RSI also shows values below 50%, indicating that the market momentum is bearish.
If the price does not successfully climb back above the 200-day moving average, a further drop toward the $0.5 support level could be expected.

The BTC Paired Chart
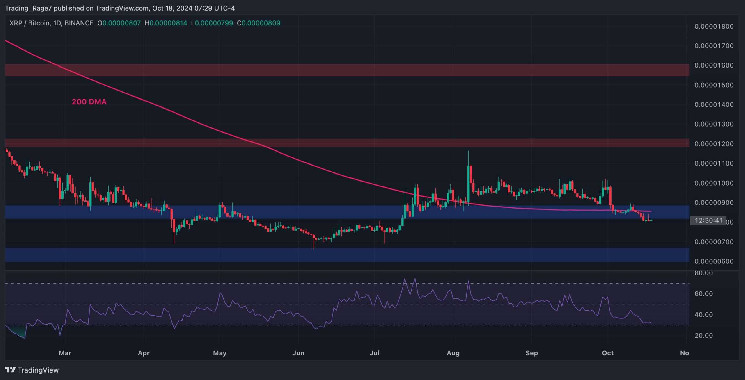
Looking at the XRP/BTC pair, the market is demonstrating similar behavior.
The price has broken below the 200-day moving average and is also breaking through the 800 SAT support level. As it stands, a further decline toward the 600 SAT support zone seems more probable than any other bullish scenario.
This would change if the market breaks back above the 200-day moving, located around the 900 SAT mark.

 cryptopotato.com