
Bonk trading shows bullish momentum following a breakout from a symmetrical triangle. The memecoin, currently trading at 0.00002375 with a 12.72% weekly gain, is drawing attention as traders expect a potential rally. If the current trend holds, analysts target a potential 16x price increase.
Symmetrical Triangle Breakout Signals Bullish Momentum
Bonk has recently broken out of a symmetrical triangle pattern characterized by converging trend lines that signal consolidation before a breakout. The breakout has occurred to the upside, suggesting that the bullish momentum is starting to build.
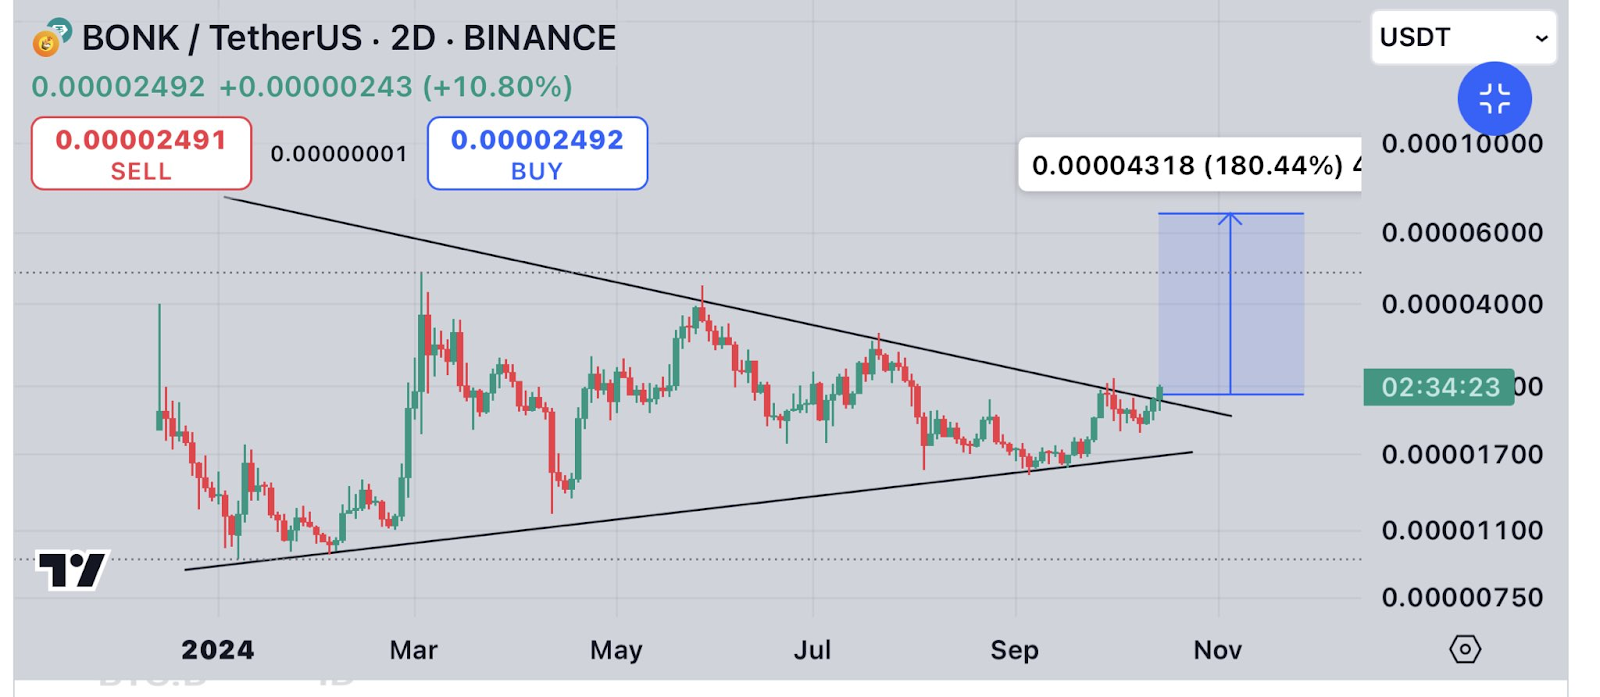
According to the analyst’s chart, the measured move from this breakout could result in a price target of 0.00004318, a potential gain of 180.44%.
Analysts Anticipate a 16X Rally Based on Chart Patterns
Several analysts predict a significant upside potential for Bonk. One analyst, Solberg Invest, compared the current chart to previous bullish patterns, stating, “While a 200x return might be a stretch this time, the chart is looking reminiscent of its explosive past.”
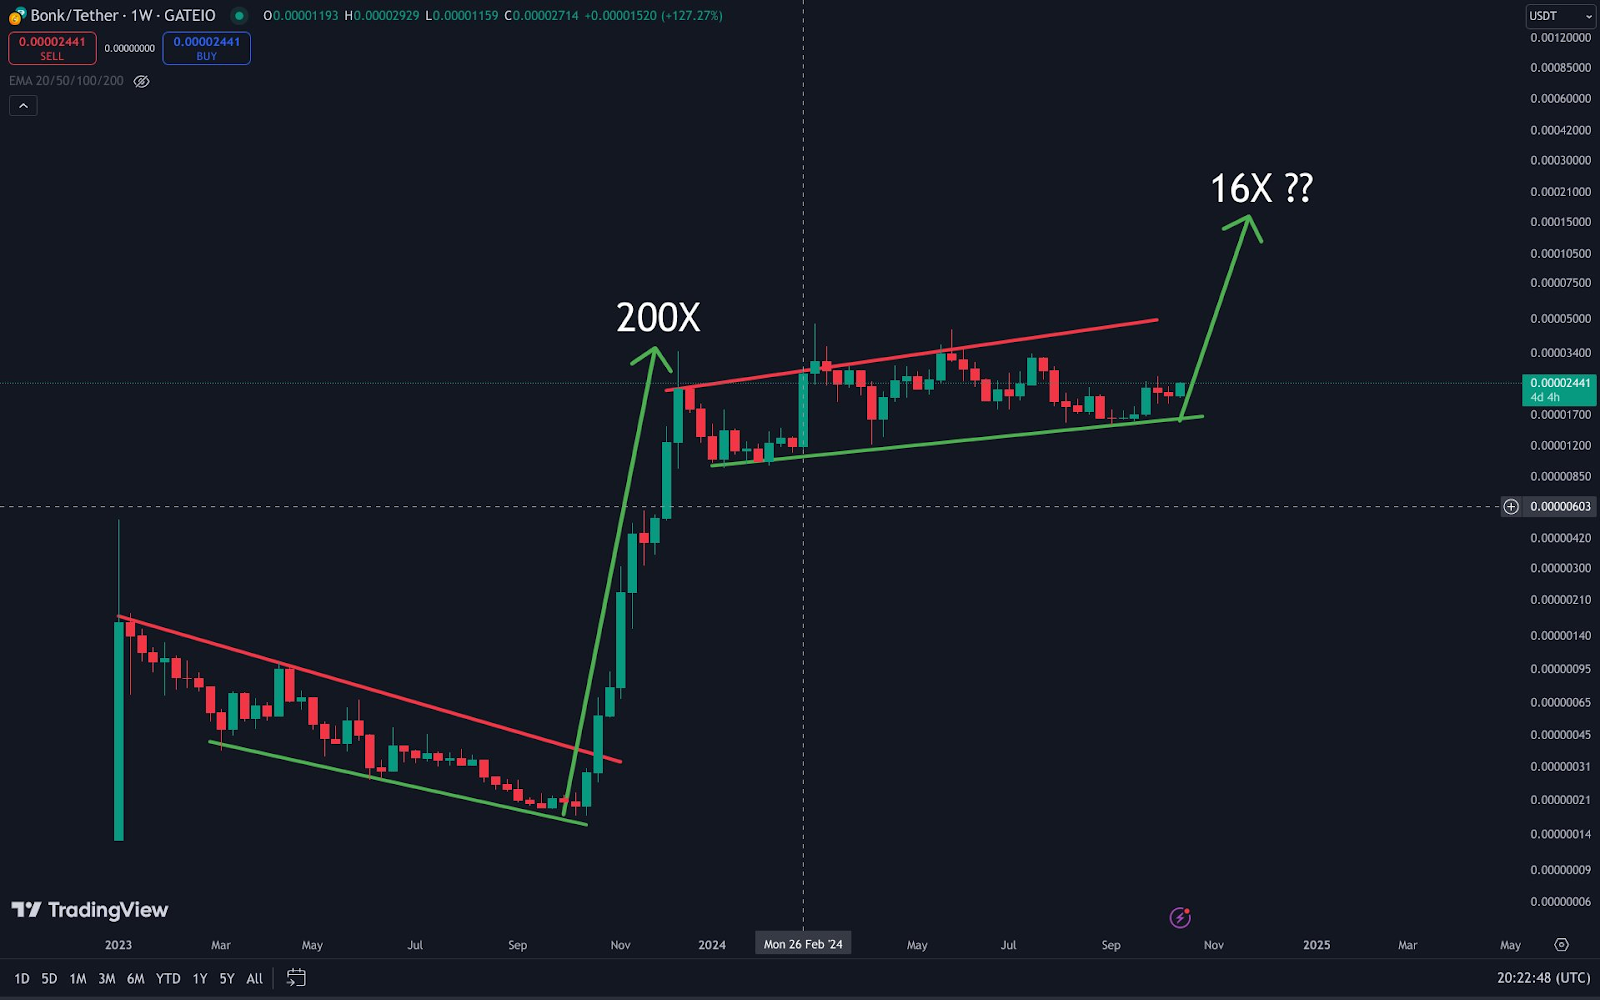
Analyst Solberg is now targeting a 16x gain, which is more realistic given Bonk’s current market cap and conditions.
The chart shows similarities to Bonk’s historical performance, where a descending wedge in the past led to a 200x price surge. Solberg’s analysis suggests a significant bullish rally could follow if Bonk breaks above the current channel resistance.
Bullish Sentiment Backed by MACD and RSI Indicators
The MACD and RSI indicators show growing bullish momentum for Bonk. The MACD line at 0.00000011 is just below the signal line at 0.00000025, but the narrowing gap signals growing positive momentum. A crossover of the MACD line above the signal line would confirm a bullish trend.
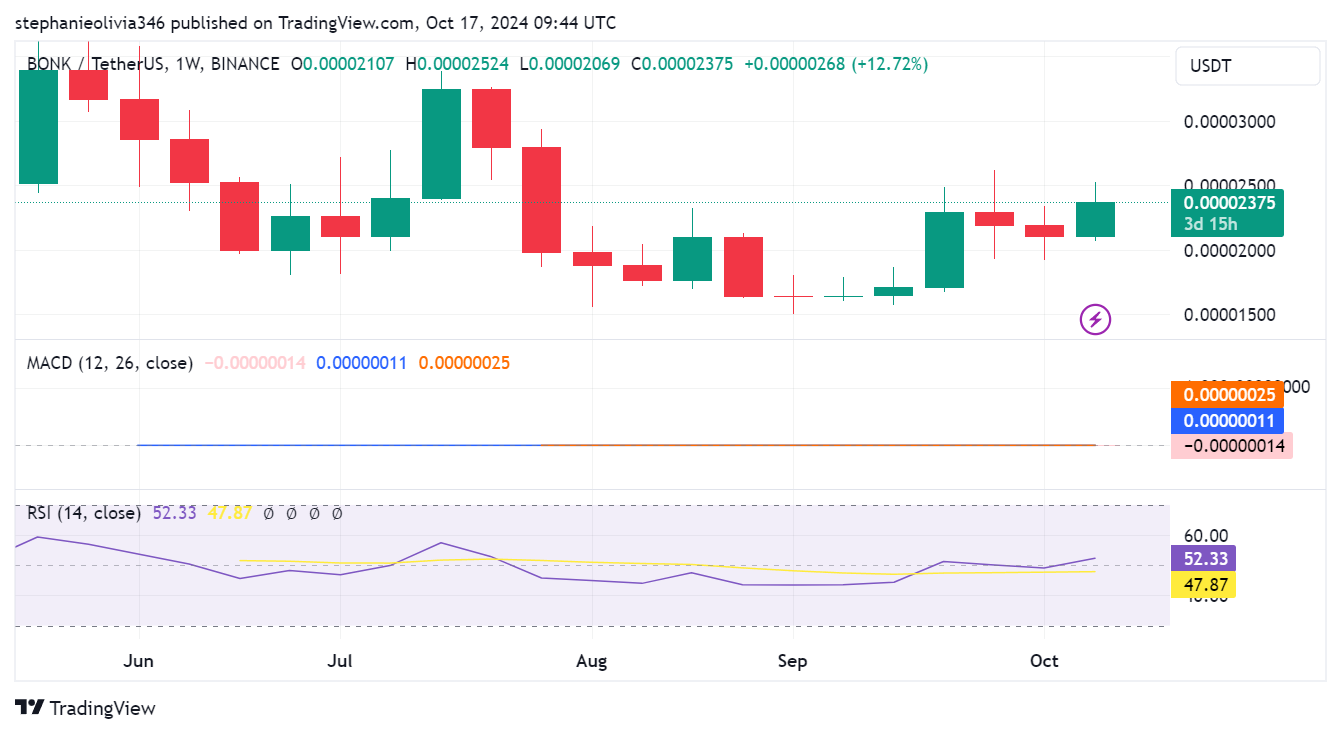
The RSI, sitting at 52.33, is trending upward, signaling potential for further gains. As it approaches higher levels, it reflects increasing buyer interest, but it has yet to reach overbought territory, meaning there is still room for upward movement.
Analysts closely monitor these indicators, which provide confirmation signals for traders. If the MACD flips bullish and the RSI continues to rise, this could trigger further buying pressure, pushing Bonk toward the following resistance levels.
Market sentiment is also shifting positively, with social media discussion highlighting Bonk’s potential for another substantial move. However, traders are cautious, waiting for confirmation from other technical indicators before committing to long positions.