Solana (SOL) price has surged by 12% over the past six days, riding a wave of bullish momentum that has seen it break through multiple resistance zones. This rally has been fueled by technical strength, including bullish EMA positioning and supportive BBTrend values.
However, with recent gains accumulating quickly, traders are now assessing if SOL can maintain this upward force. The ability to test and hold key resistance levels will be crucial in shaping the next price movement.
BBTrend Suggests SOL Bulls Are Strong
SOL BBTrend is currently positive, around 8.08, indicating a solid bullish momentum for Solana. This means that the price is trading above the middle Bollinger Band, showing a favorable market sentiment.
A positive BBTrend often suggests that the price trend is well-supported, and the asset could continue its upward trajectory. However, the BBTrend alone should be complemented with other indicators to confirm the overall strength and sustainability of the trend.
Read more: 13 Best Solana (SOL) Wallets To Consider in October 2024
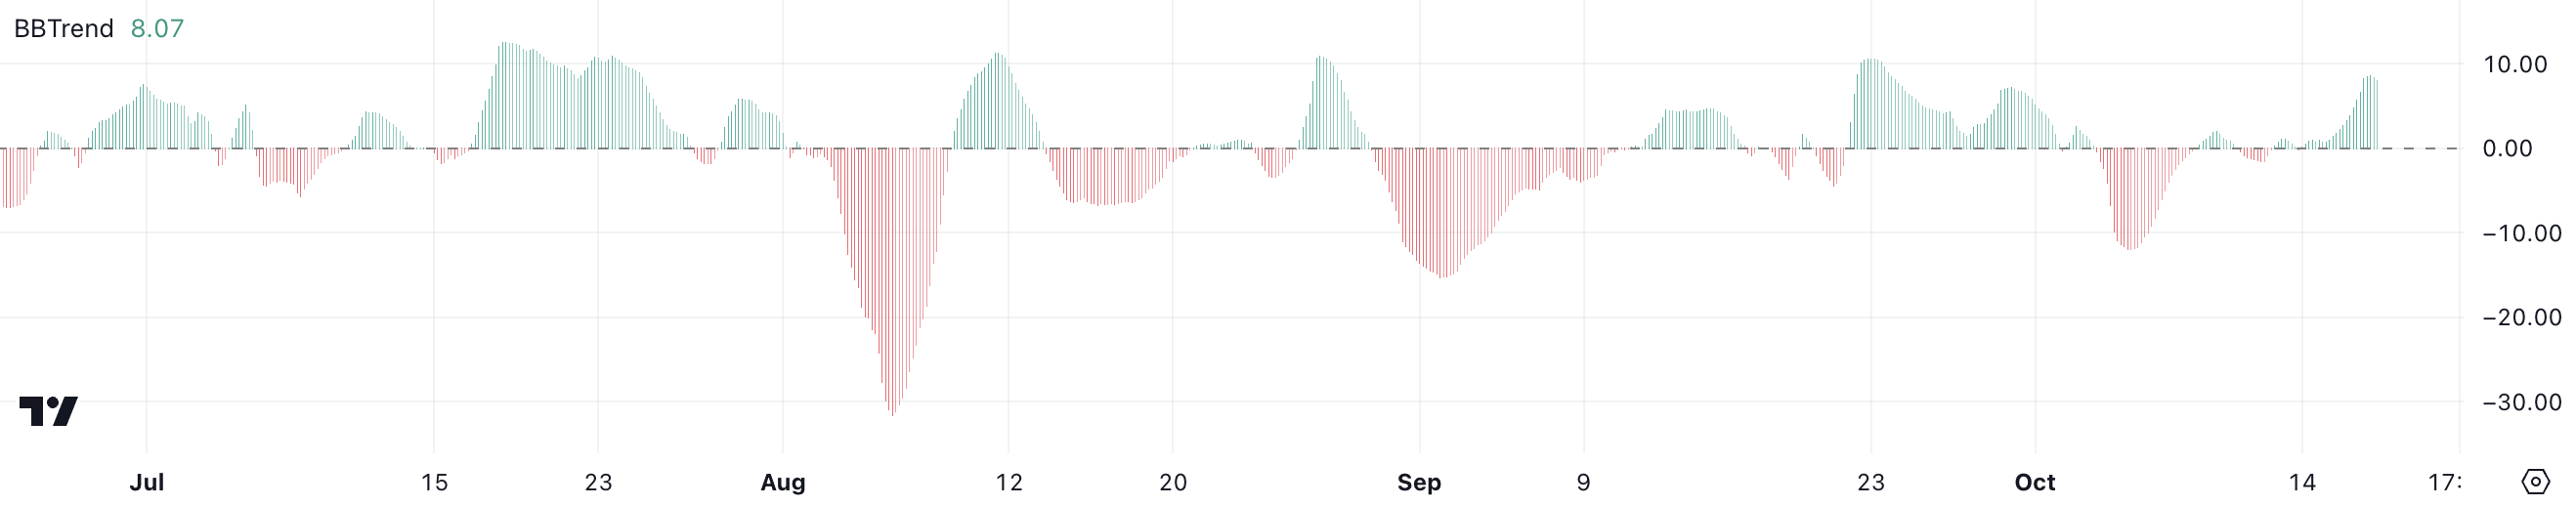
The BBTrend metric measures the strength and direction of the trend using Bollinger Bands, which track volatility. While the current BBTrend value remains positive, it has dropped from 9.01 over the past few days, suggesting that Solana’s bullish momentum might be waning.
This decline could imply that the current trend is weakening, meaning SOL price may face increased resistance and possibly a shift towards a more neutral or sideways movement.
Solana Current Uptrend Could Be Losing Momentum
The SOL DMI chart reveals that the current uptrend strength is at 34, as indicated by the yellow line, which represents the Average Directional Index (ADX). ADX is a key component of the Directional Movement Index (DMI) and is used to gauge the strength of a trend, regardless of its direction.
The ADX itself is a measure that helps traders understand how strong the current price movement is. A reading above 20 generally indicates a strong trend, and with an ADX of 34, Solana is currently in a strong uptrend, suggesting there is still notable momentum behind recent price action.
In Solana’s case, the reading of 34 suggests that the uptrend is substantial, but traders need to keep an eye on whether ADX continues rising or starts to plateau, as this can hint at changes in trend strength.
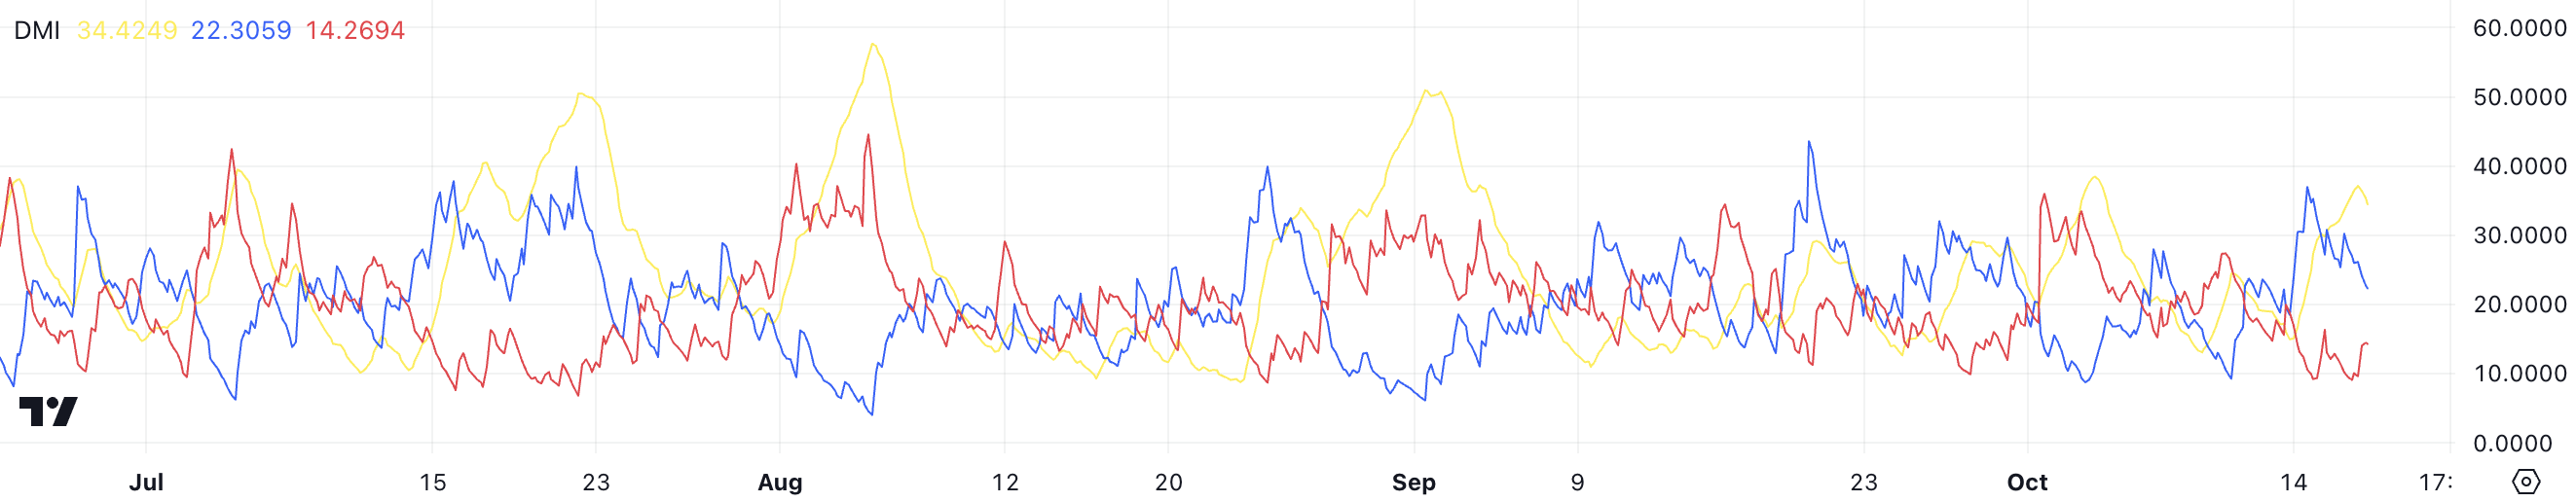
Additionally, the DMI chart reveals that the positive directional indicator (D+) stands at 22.3, while the negative directional indicator (D-) is at 14.2. The higher D+ suggests buyers still have control of the market. However, just two days ago, D+ was at 36.7, and D- was at 9.15, indicating the gap between them is shrinking, which could point to weakening buyer momentum.
The narrowing gap suggests weakening bullish momentum and increasing selling pressure. If this trend persists, it could signal a shift toward a more indecisive market, where bulls lose dominance. This may lead to more volatile price action or consolidation.
SOL Price Prediction: A 12% Correction Or a 27,8% Price Surge?
SOL’s EMA lines remain bullish, with short-term exponential moving averages (EMAs) positioned above the long-term EMAs. This arrangement suggests that the price trend is currently in an upward phase, with recent price movements exceeding the longer-term average.
However, the short-term EMAs are starting to trend downward, indicating a potential loss of momentum. If these shorter-term lines cross below the longer-term EMAs, it could be a bearish crossover, signaling the beginning of a downtrend. Traders typically view this “death cross” as an early warning that the prevailing bullish trend is weakening.
Read more: 7 Best Platforms To Buy Solana (SOL) in 2024
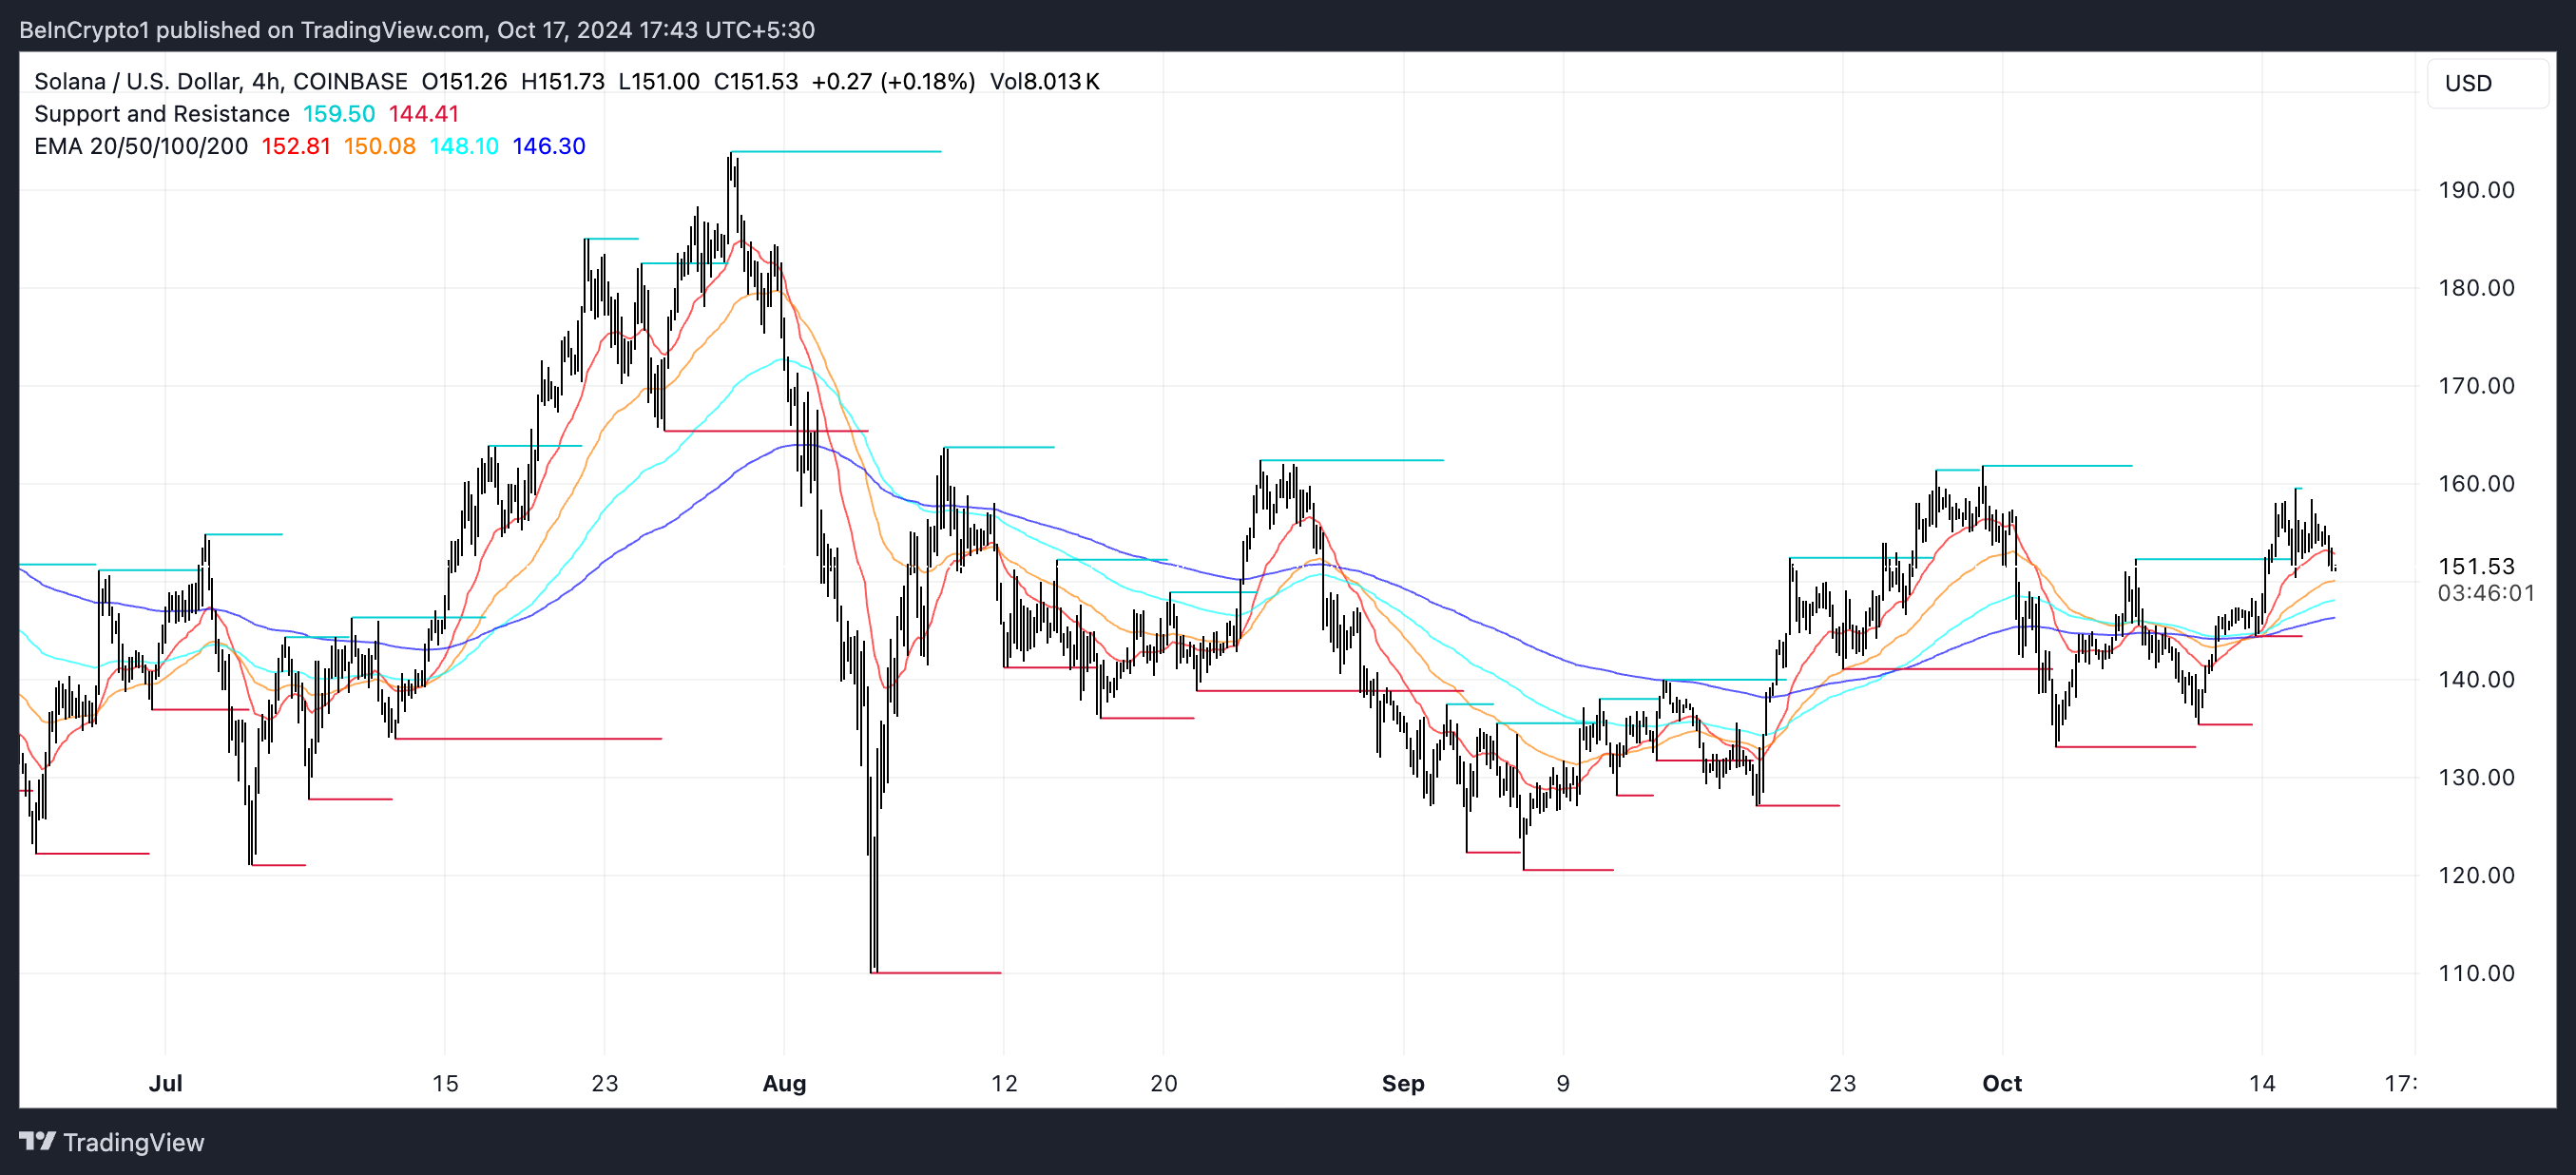
Given the current situation, SOL could test support levels at $144 and $141. If the selling pressure persists, the price might even dip as low as $133, which would be around a 12% correction from current levels. These support zones could play a crucial role in stabilizing the price and providing a platform for potential recovery.
On the flip side, if the bullish momentum returns and the uptrend gains strength, SOL could move back up to the $161 level. Should it break this resistance, the next target might be $193, implying a potential price gain of around 27.8%. This scenario would reaffirm the continuation of the bullish trend, with further upside likely if buyers regain control.