
Ripple (XRP) price has been relatively stable with no clear trend direction emerging. The RSI indicator shows a neutral sentiment, suggesting a balance between buying and selling activity. Meanwhile, the Chaikin Money Flow has turned positive, pointing to some accumulation, but the buying pressure remains modest.
The EMA lines are still in a bearish alignment, though a bullish crossover may be on the horizon. If buying pressure strengthens, XRP could potentially break through key resistance levels in the coming days.
XRP RSI Has Been Neutral For Days
XRP’s Relative Strength Index (RSI) is currently at 58.59 and has been hovering between the 45 to 65 range for nearly a week. This indicates a lack of strong price momentum in either direction. Typically, an RSI around 50 suggests neutral sentiment, where buyers and sellers are relatively balanced.
The recent RSI movement within this range implies that XRP’s price has been relatively stable, neither reaching overbought nor oversold conditions, which often characterizes a market waiting for stronger cues to establish a trend.
Read More: XRP ETF Explained: What It Is and How It Works
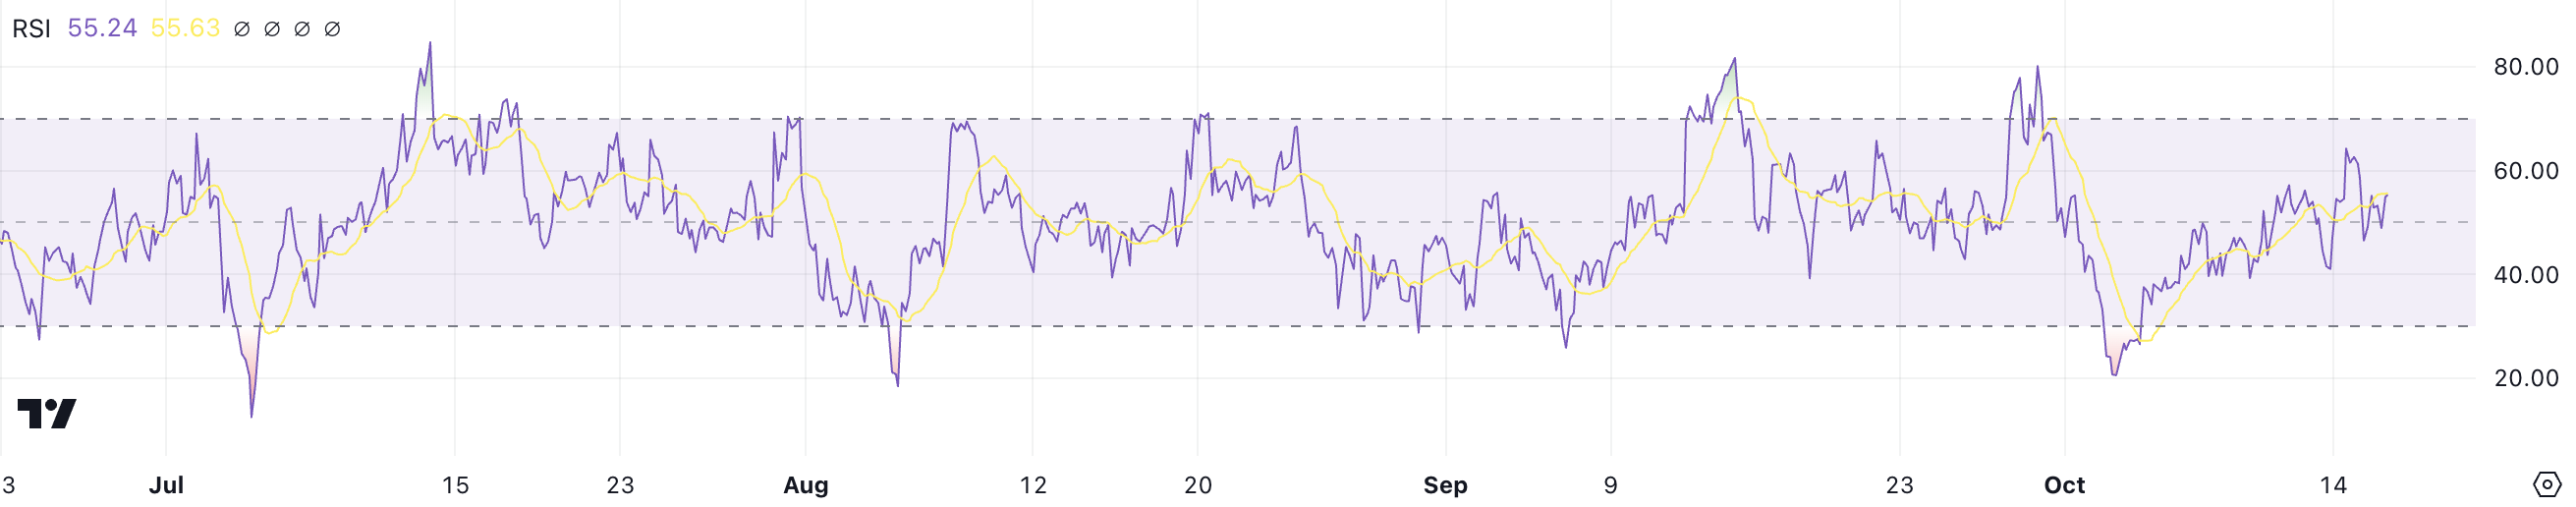
The RSI is a momentum oscillator ranging from 0 to 100, commonly used to assess whether an asset is overbought or oversold. An RSI above 70 typically indicates overbought conditions, suggesting a potential price correction. An RSI below 30 signals oversold conditions, which could present a buying opportunity.
With XRP’s RSI at 58.59, it shows moderate buying strength, but not enough to push the asset into overbought territory. This level indicates that while there is some positive sentiment around XRP, it is not yet strong enough to drive a significant trend. This leaves the price direction uncertain and suggesting a continued consolidation phase.
Ripple CMF Is Now Positive
XRP’s Chaikin Money Flow (CMF) indicator is currently at 0.08, recovering from a recent dip to -0.10. This shift from negative to positive suggests that buying pressure has started to outweigh selling pressure, indicating some accumulation of XRP.
However, despite turning positive, the value of 0.08 reflects only a modest level of capital inflow, suggesting that the buying momentum is still relatively weak.
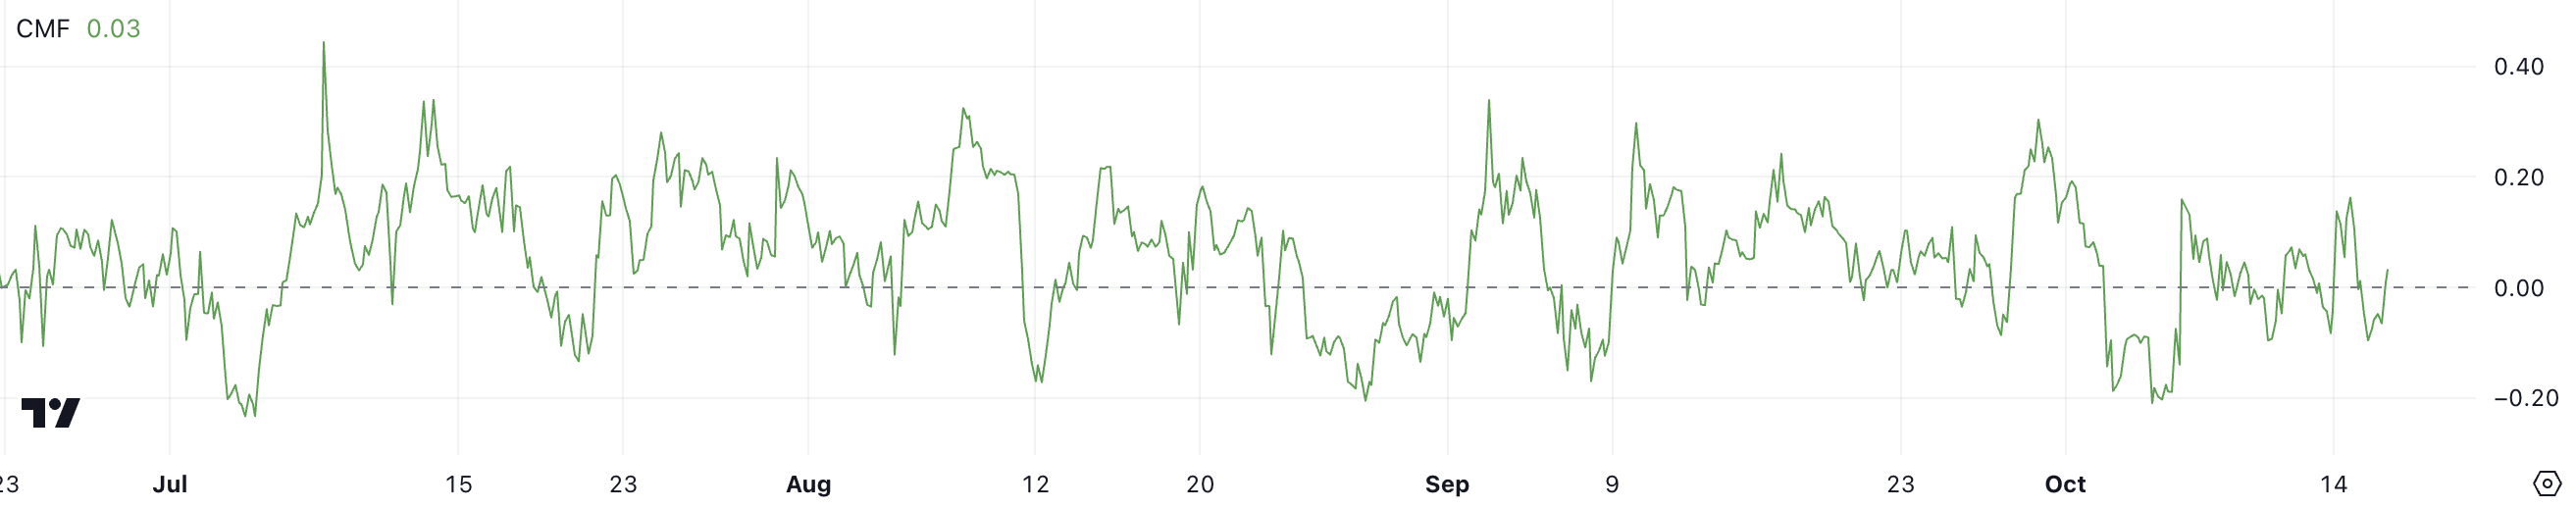
The Chaikin Money Flow is a technical indicator that measures the buying and selling pressure of an asset, based on the closing price and volume of trades. Positive CMF values indicate net buying pressure, whereas negative values suggest net selling pressure.
Although XRP’s current CMF value of 0.08 shows signs of buying activity, it remains significantly below the 0.15 to 0.20 levels that were seen during XRP’s last rally in late September. This suggests that while the buying sentiment has improved, it is not yet at the strength needed to trigger a sustained upward move.
XRP Price Prediction: A 22% Price Surge Ahead?
XRP’s EMA (Exponential Moving Average) lines are currently in a bearish formation, with shorter-term EMAs positioned below the longer-term EMAs. This alignment suggests that the prevailing trend has been downward. However, the short-term EMAs now appear to be moving upwards, potentially crossing above the long-term EMAs.
If this crossover occurs, it could signal a shift to a bullish trend, where buying pressure starts to dominate, potentially sparking a new upward momentum in XRP’s price.
Read more: Ripple (XRP) Price Prediction 2024/2025/2030
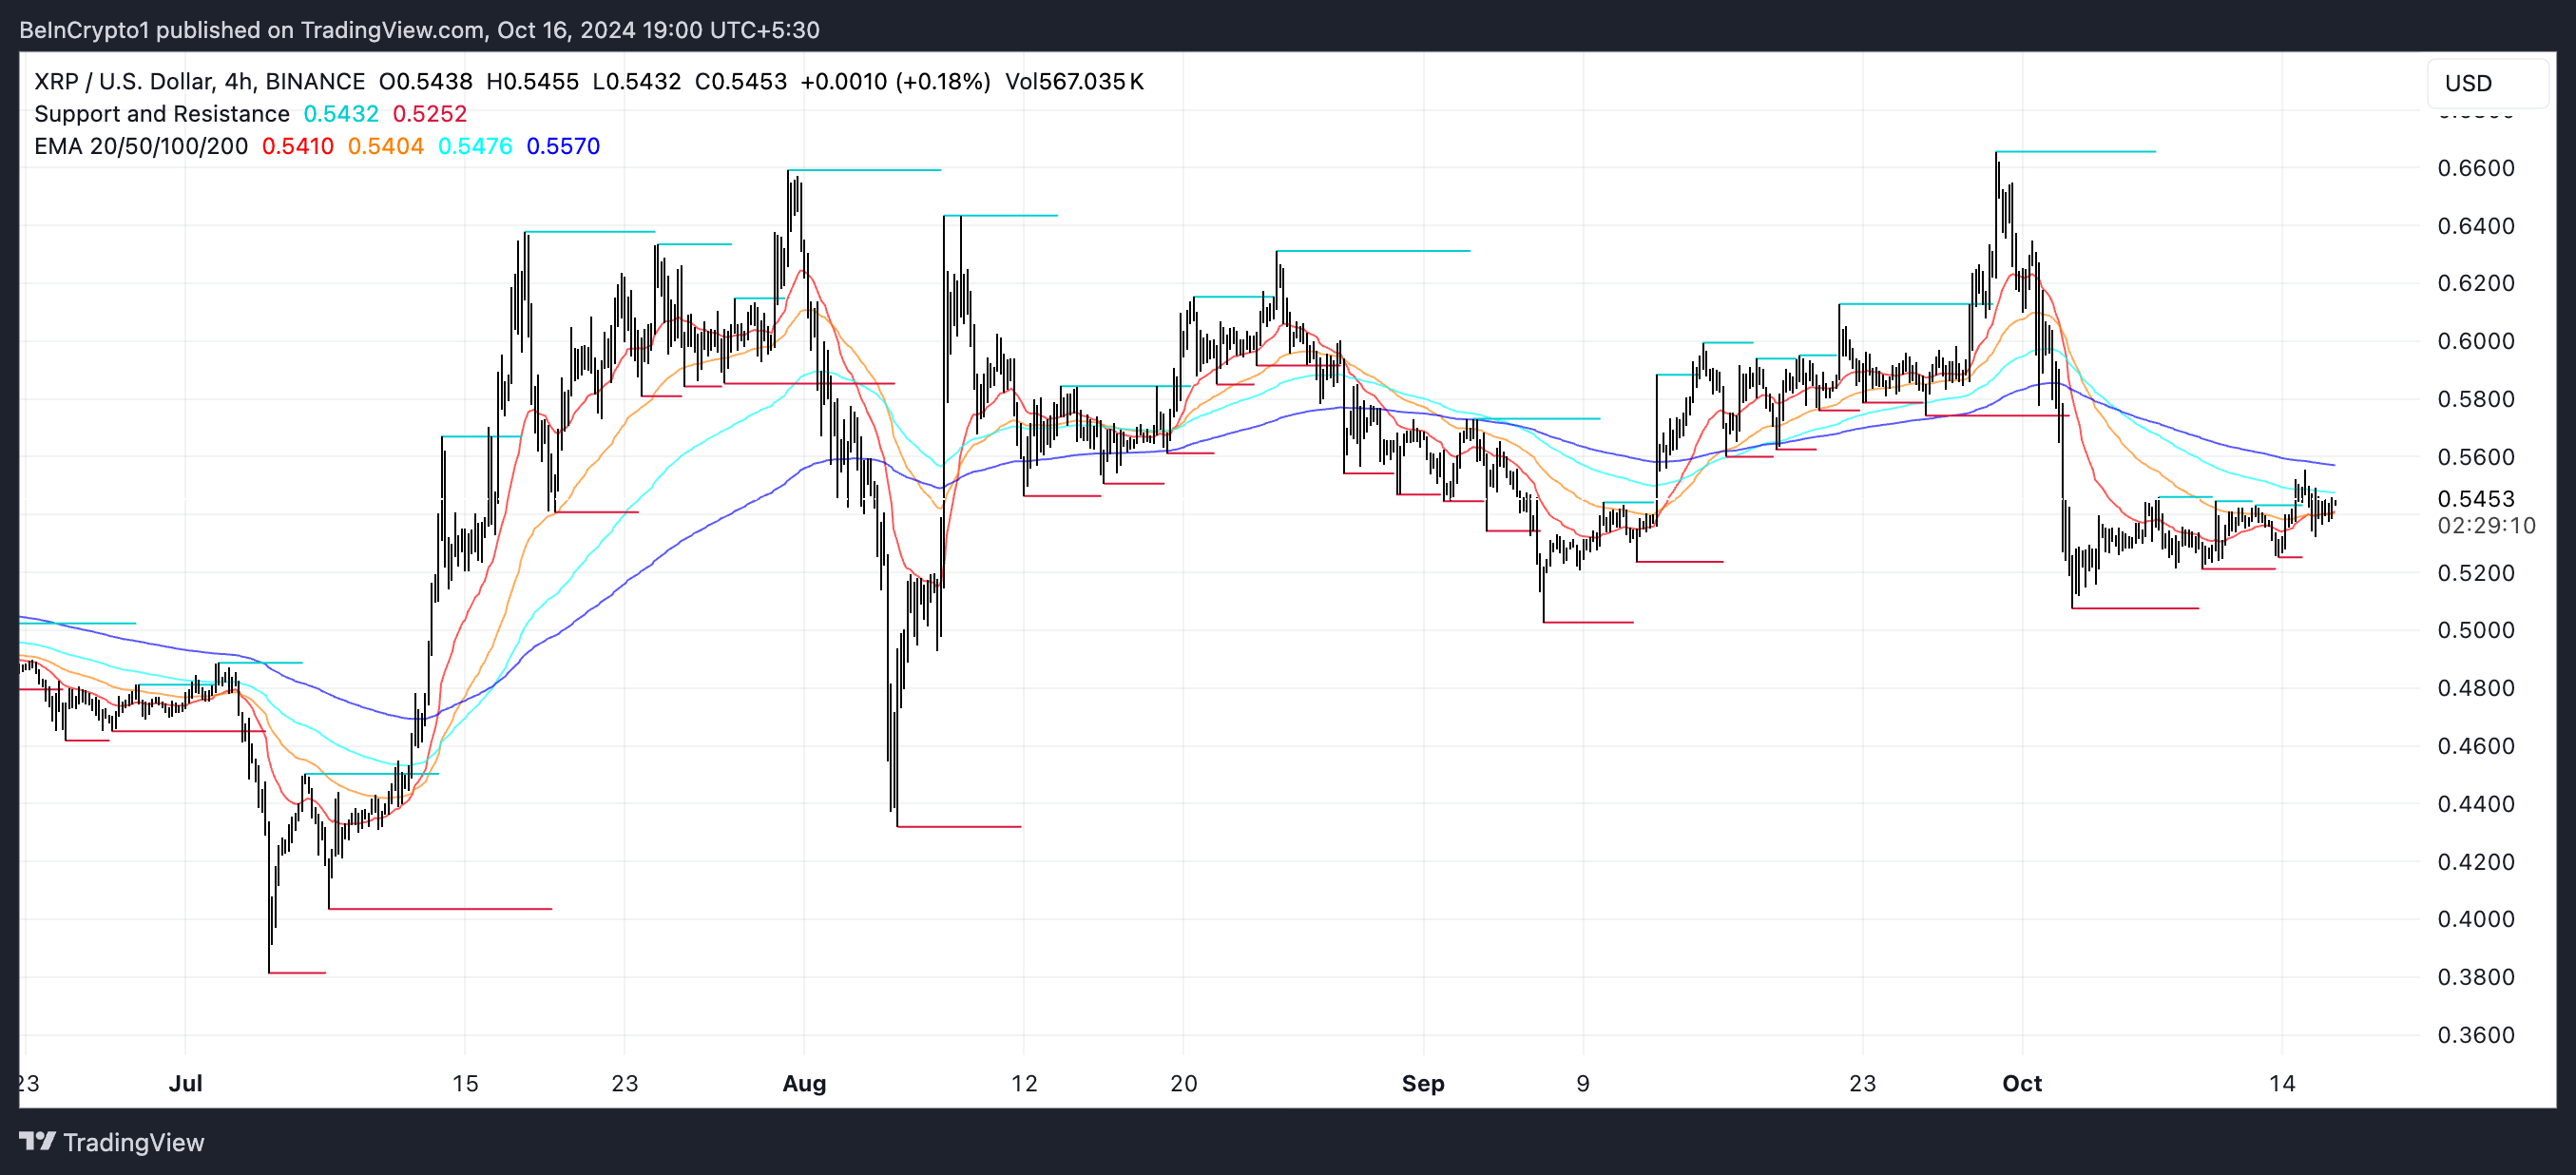
EMA lines are moving averages that assign greater weight to recent price data, making them more responsive to short-term market changes. Traders often use EMAs to identify trends and potential reversals. When short-term EMAs cross above long-term EMAs, it is typically considered a bullish signal. That indicates that recent buying strength could lead to a sustained rally.
If this uptrend materializes, XRP could test resistance levels at $0.61, and potentially push further to $0.63 or even $0.66. That would depend on the strength of the buying momentum. However, if the bullish crossover fails to materialize, XRP might instead continue its bearish trend, potentially falling to the support levels of $0.50 or even as low as $0.43 if selling pressure increases.