
Toncoin (TON) price has experienced a significant rise in its Relative Strength Index, moving from an oversold position to a neutral level. Despite this increase, the RSI remains in a neutral range, indicating no clear trend dominance.
Additionally, the stable supply of TON on exchanges suggests traders are hesitant to commit to major moves. With the EMA lines showing a weak bearish alignment, TON appears to be in a consolidation phase.
TON RSI Is Currently Neutral
TON’s RSI is currently at 45.56, a notable increase from 30 on October 9. This recent uptick indicates that buying momentum has improved, with a recovery from oversold conditions just a few days ago. The move up from 30 suggests that selling pressure has significantly weakened, leading to a stabilization in price action.
However, despite this upward shift, the RSI is still within a neutral range. The current level reflects a market in transition, where neither buyers nor sellers have taken firm control.
RSI, or Relative Strength Index, is a momentum oscillator used to gauge the speed and magnitude of recent price changes. RSI values above 70 indicate an asset may be overbought, suggesting a possible pullback. On the other hand, values below 30 typically signal oversold conditions, often hinting at a potential reversal upward.
Read more: 6 Best Toncoin (TON) Wallets in 2024
TON’s current RSI of 45 sits comfortably between these extremes. In this neutral zone, RSI does not offer a clear directional cue, implying that TON price might continue its consolidation phase.
The market appears to be searching for clarity, with current momentum insufficient to drive a strong breakout or breakdown. As a result, it’s entirely possible that TON remains range-bound in the near term, waiting for a more definitive catalyst to shift its trend direction.
Toncoin Supply On Exchanges Is Stable
Between September 29 and October 2, TON’s supply on exchanges declined substantially, dropping from 2.29 million to 1.56 million. This significant reduction suggests that many holders were withdrawing their tokens from exchanges, possibly moving them to personal wallets. Since then, however, the supply on exchanges has risen slightly, now sitting at 1.63 million.
This partial recovery may indicate some traders are preparing to re-enter the market, potentially seeking trading opportunities. Despite this rebound, the overall supply remains well below the late September levels, showing a shift in investor sentiment compared to the prior surge in exchange balances.
Typically, when a coin’s supply on exchanges increases, it’s seen as a bearish signal. Coins moved to exchanges are often intended for selling, creating additional selling pressure.
This is exactly what happened during the early October period for TON, when the price dropped from $5.88 to $5.34 in response to increased exchange supply. However, the recent stability in the supply of TON on exchanges suggests that the market may not currently have a strong directional bias.
The relative stability of around 1.63 million implies that traders and investors are waiting on the sidelines, neither accumulating in personal wallets nor preparing for a significant sell-off. This period of calm indicates indecision, as market participants are waiting for clearer signals before making further moves.
This suggests that TON may remain in a consolidation phase until a catalyst shifts the balance either way.
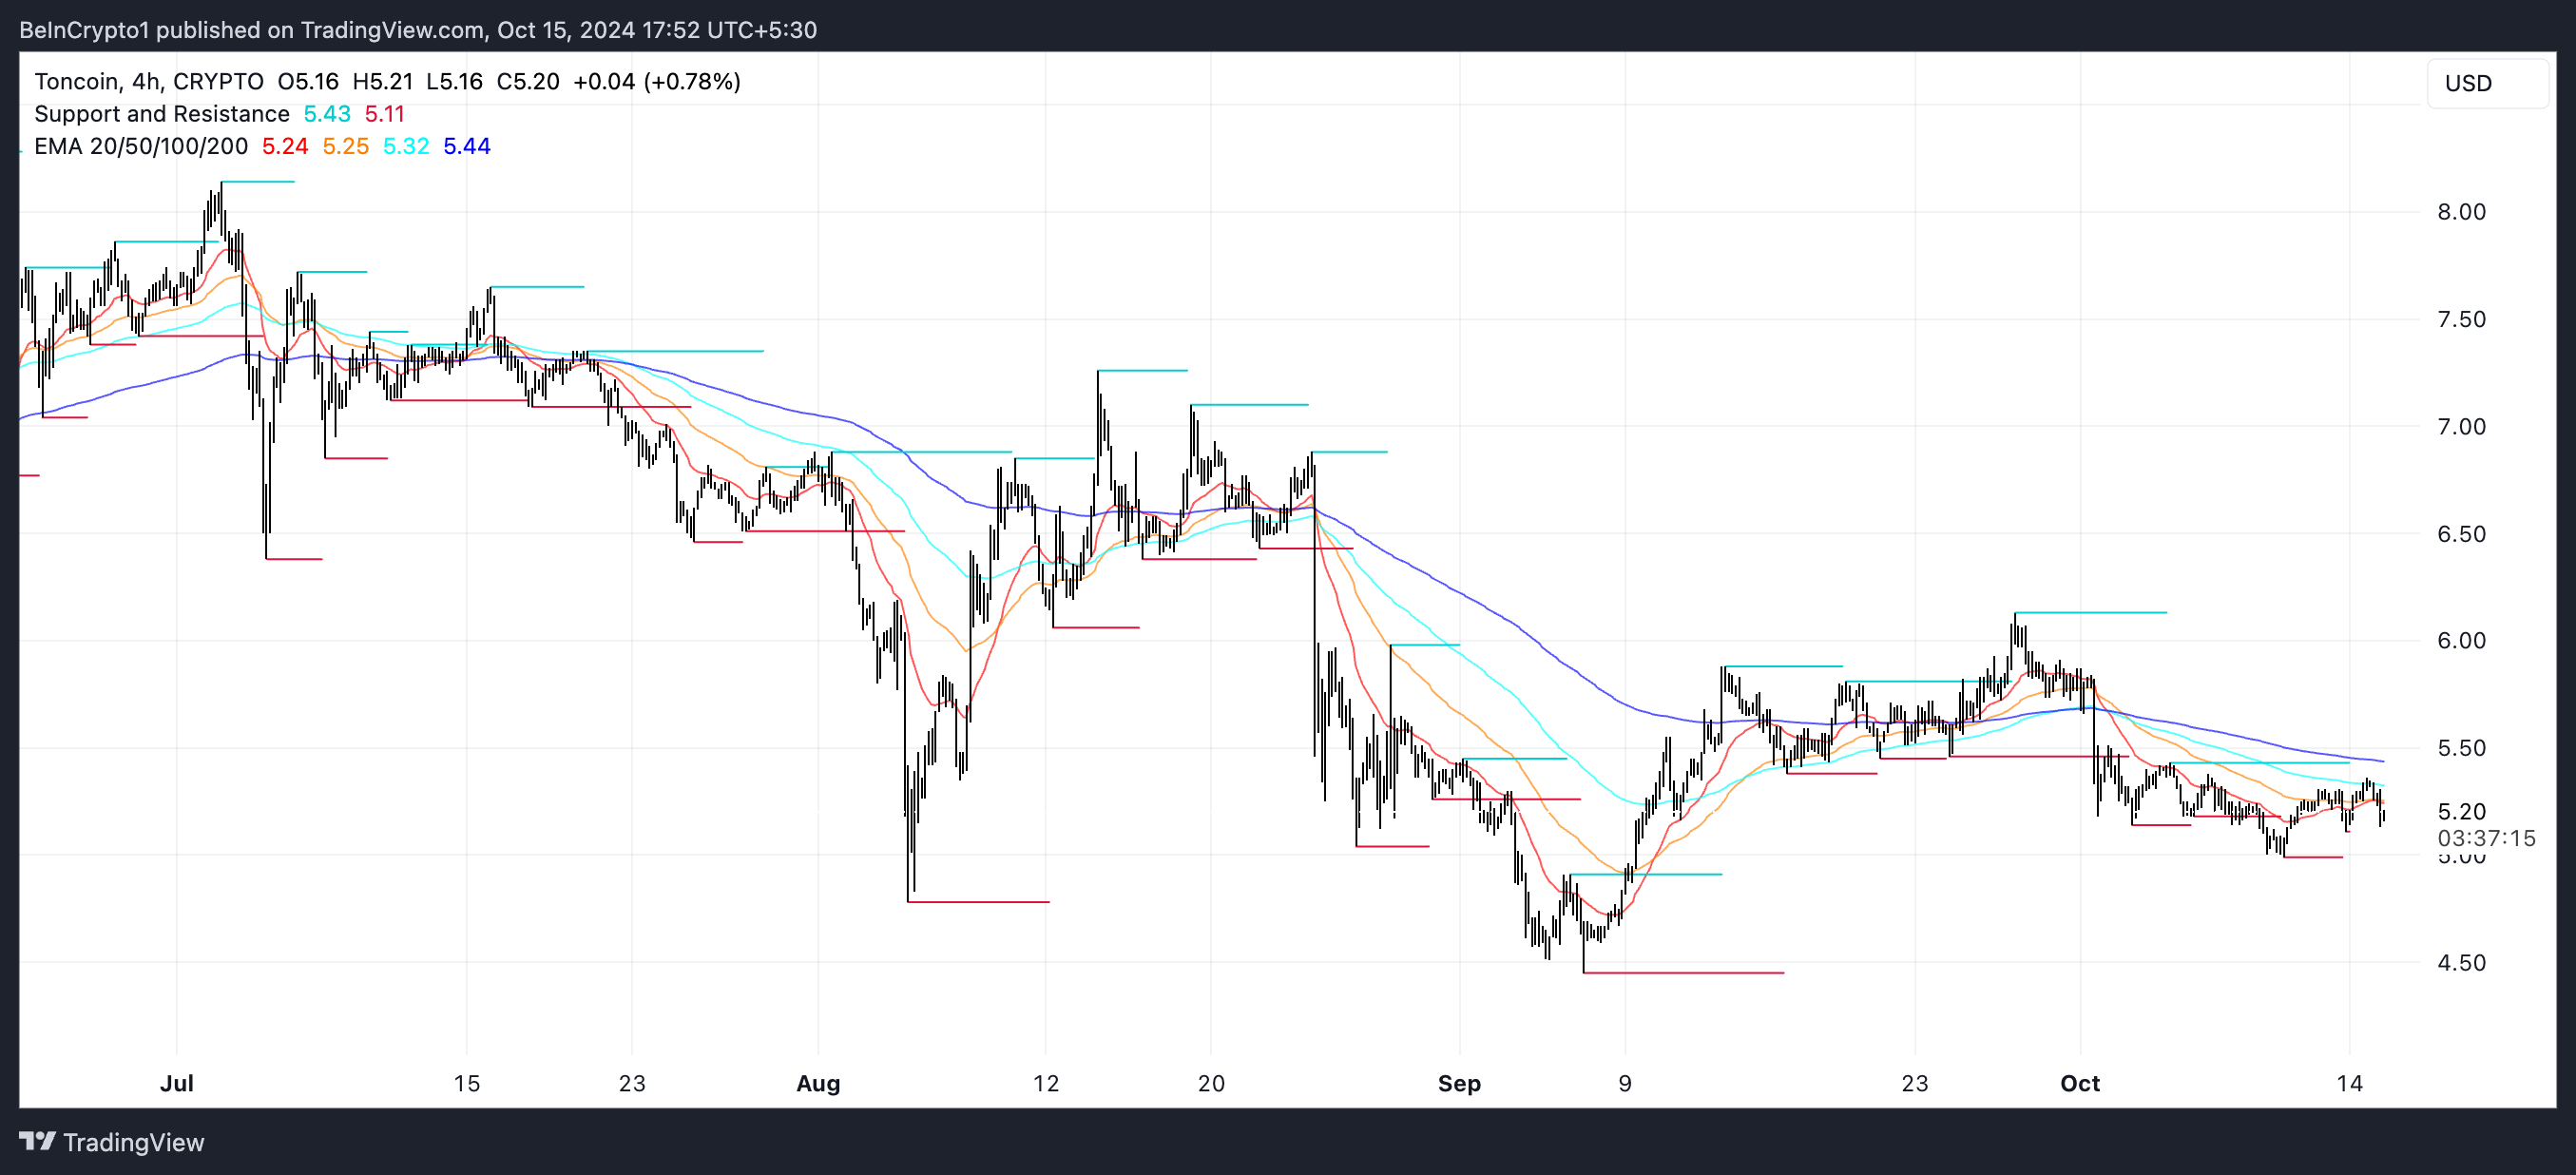
TON Price Prediction: Possible Rebound Back to $6.13?
Currently, TON’s EMA lines indicate a bearish trend, with short-term moving averages positioned below the long-term ones. This alignment typically signals that downward pressure is prevailing. However, the distance between the short-term and long-term EMAs is quite small, suggesting that the bearish trend may not be particularly strong.
When these moving averages are close to each other, it implies that price momentum is not decisively negative, and any shift in market sentiment could quickly alter the trend direction. The convergence of these lines is a sign of uncertainty, indicating that traders should be cautious before making assumptions about a sustained downturn.
EMA, or Exponential Moving Average, is a technical indicator used to track the average price of an asset over a specific period. It gives more weight to recent price data to better reflect momentum. Short-term EMA lines respond quickly to price changes, while long-term EMAs are slower to react.
Read more: Top 9 Telegram Channels for Crypto Signals in October 2024
When the short-term EMA falls below the long-term EMA, it signals that recent price action is weaker compared to the longer trend. This is typically interpreted as bearish.
If this current downtrend in TON becomes more pronounced, the price could test lower support levels, potentially dropping to $4.99 or even $4.78. However, should sentiment improve and the trend reverse, TON price could recover to retest the $5.88 zone and possibly move higher to $6.13, suggesting a renewed bullish momentum.
The small gap between EMA lines makes both scenarios possible, depending on how market forces evolve.