In this article, BeInCrypto takes a look at the seven altcoins that have decrease the most over the last seven days, from Dec 31 to Jan 7.
These altcoins are:
- SushiSwap (SUSHI) : -31.71%
- Kadena (KDA) : -25.27%
- Gala (GALA) : -24.70%
- Axie Infinity (AXS) : -23.62%
- Aave (AAVE) : -21.51%
- IOTA (MIOTA) : -20.61%
- Gnosis (GNO) : -20.57%
SUSHI
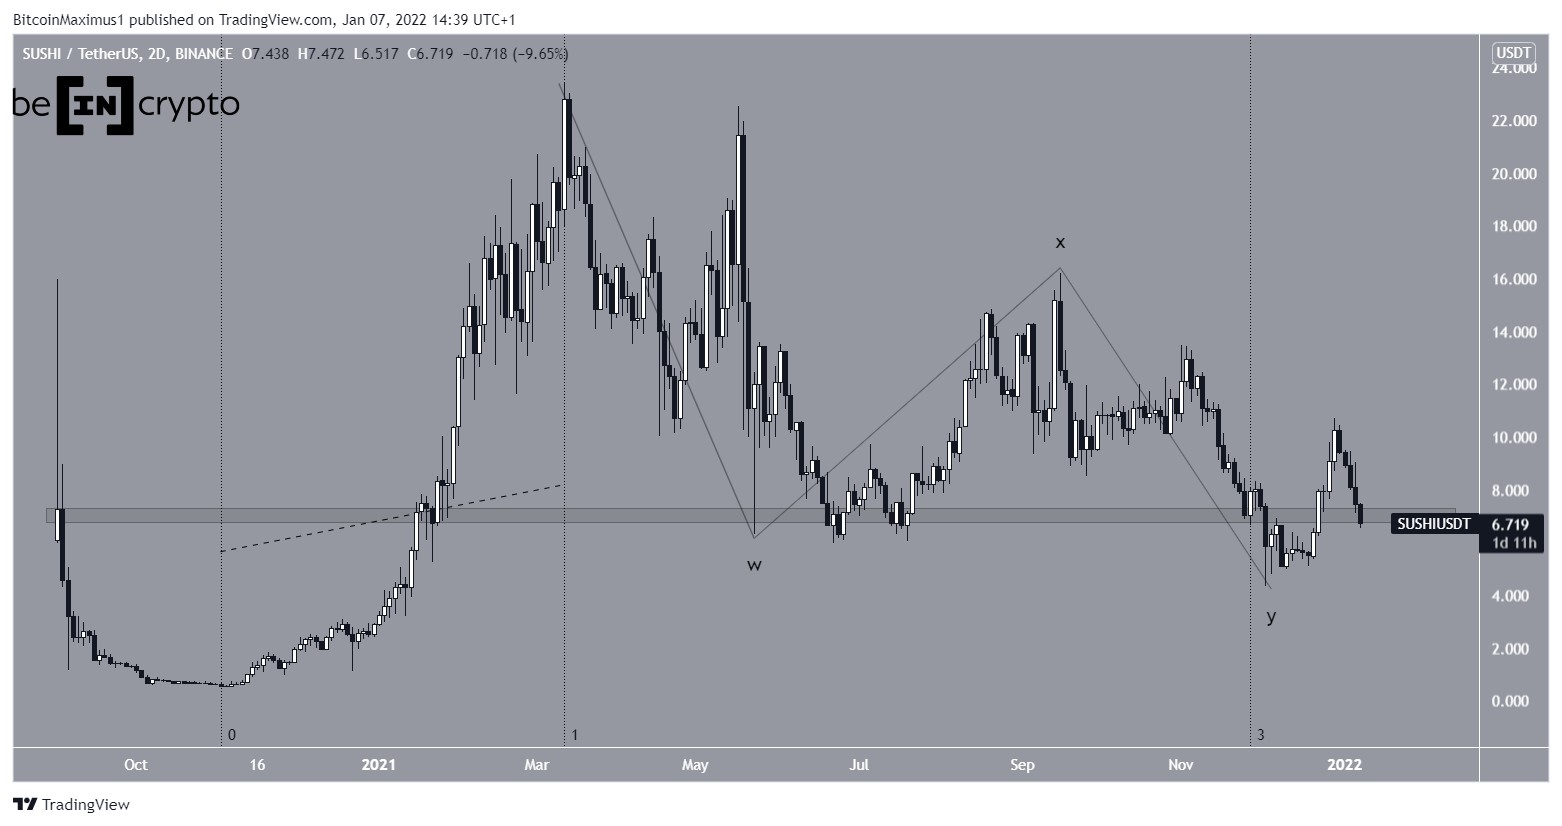
SUSHI has been moving downwards since its all-time high of $23.4 on March 13. The downward movement could be a completed corrective structure, which lasted twice as long (dashed lines) as the preceding upward movement.
In this possibility, SUSHI would initiate an upward movement similar to the one on Jan 2021 that would continue in the long-term.
However, in order for this possibility to remain valid, SUSHI has to reclaim the $7 area, which has intermittently acted as either resistance or support since Sept 2020.
KDA
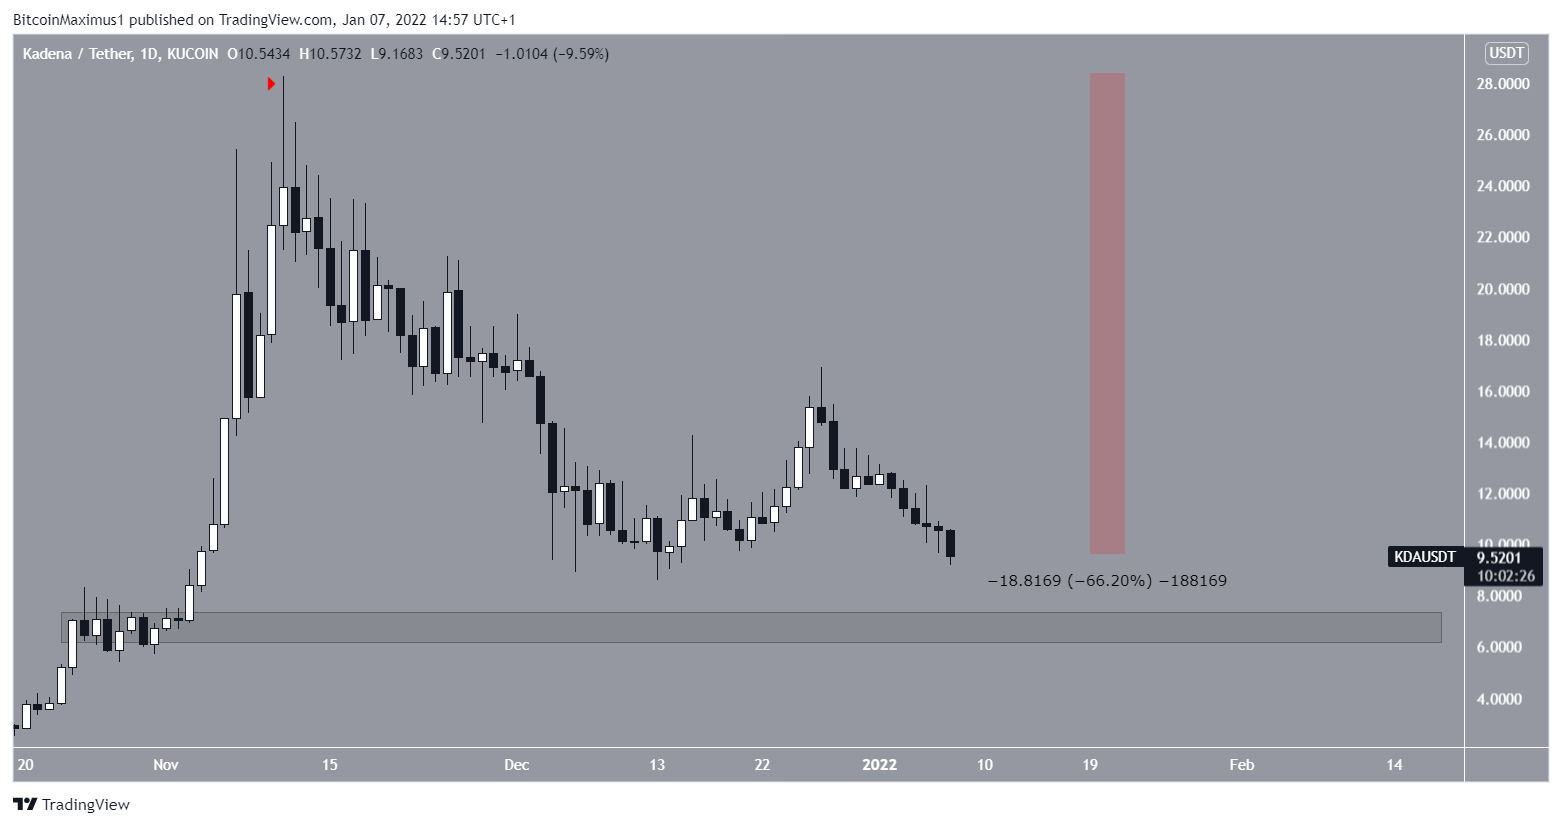
KDA has been falling since reaching an all-time high price of $28.3 on Nov 11(red icon). Since then, it has decreased by 66%.
The main support area is at $6.20, created by the Oct-Nov 2021 lows.
GALA
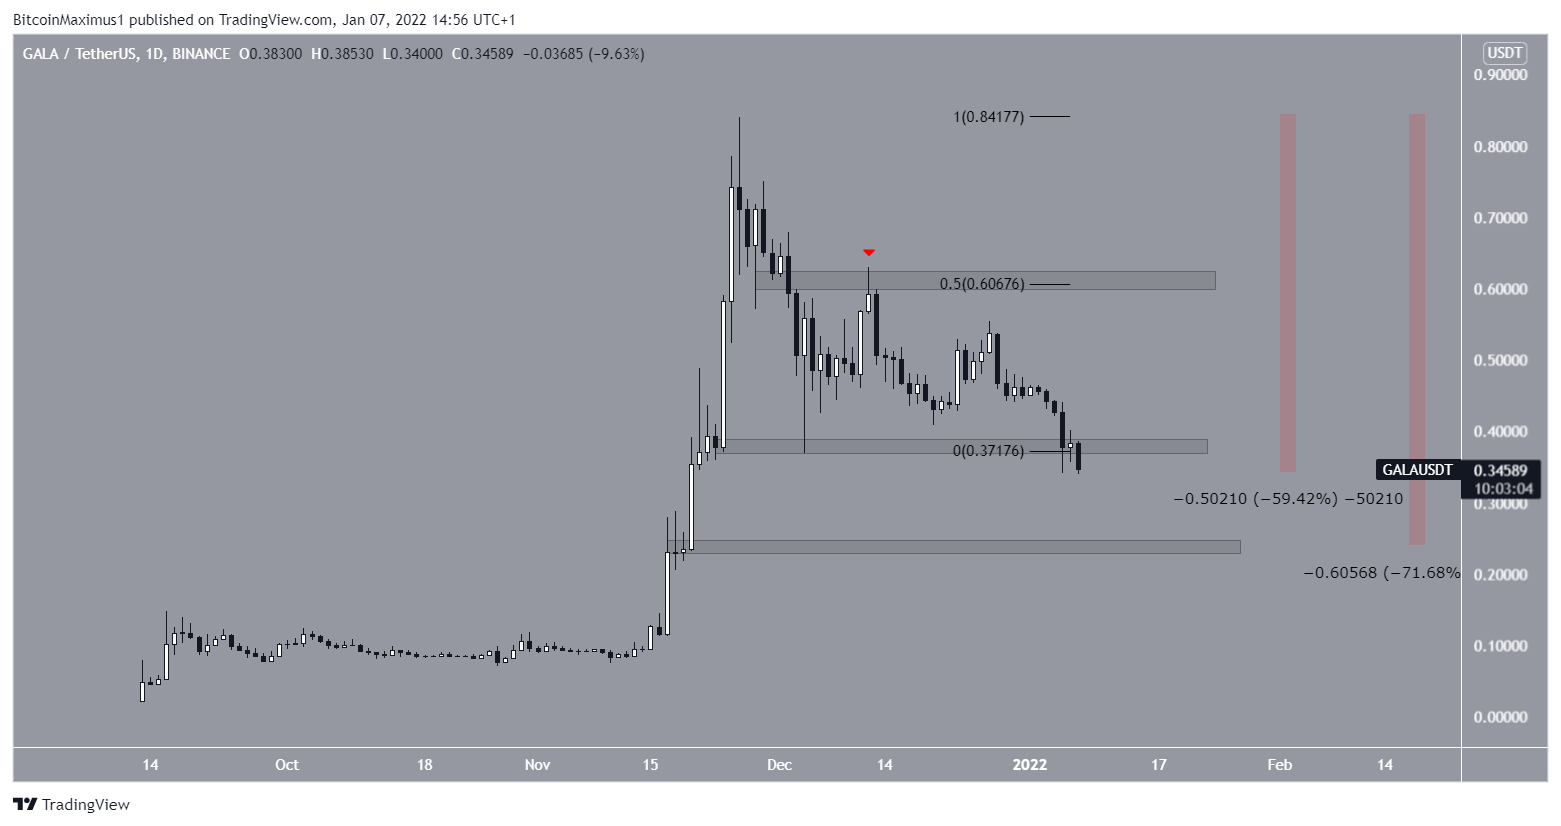
GALA has also been decreasing since its all-time high of $0.84 on Nov 26. On Dec 13, it validated the $0.61 horizontal resistance area and resumed its descent.
On Jan 7, the token decisively broke down from the $0.38 area and has now fallen by 60% since its all-time high.
The main support area is at $0.235, which would amount to a 71.68% fall since the aforementioned high.
AXS
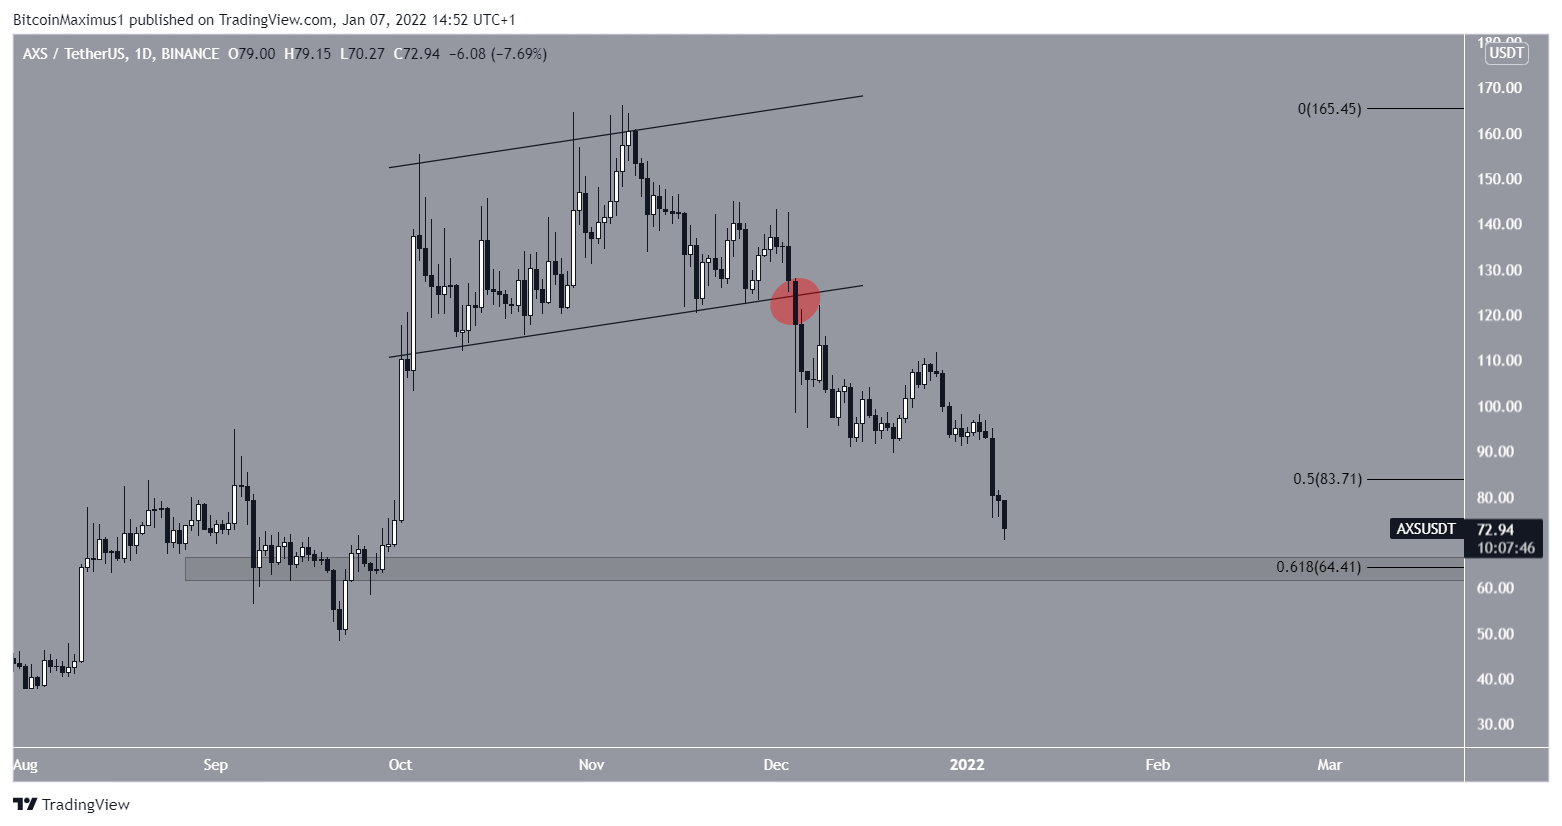
AXS has been falling since breaking down from an ascending parallel channel (red circle) on Dec 5. The downward movement has so far led to a low of $70.27, reached on Jan 7.
The closest support area is at $64.4, created by the 0.618 Fib retracement support level. It is possible that the area will initiate a bounce.
AAVE
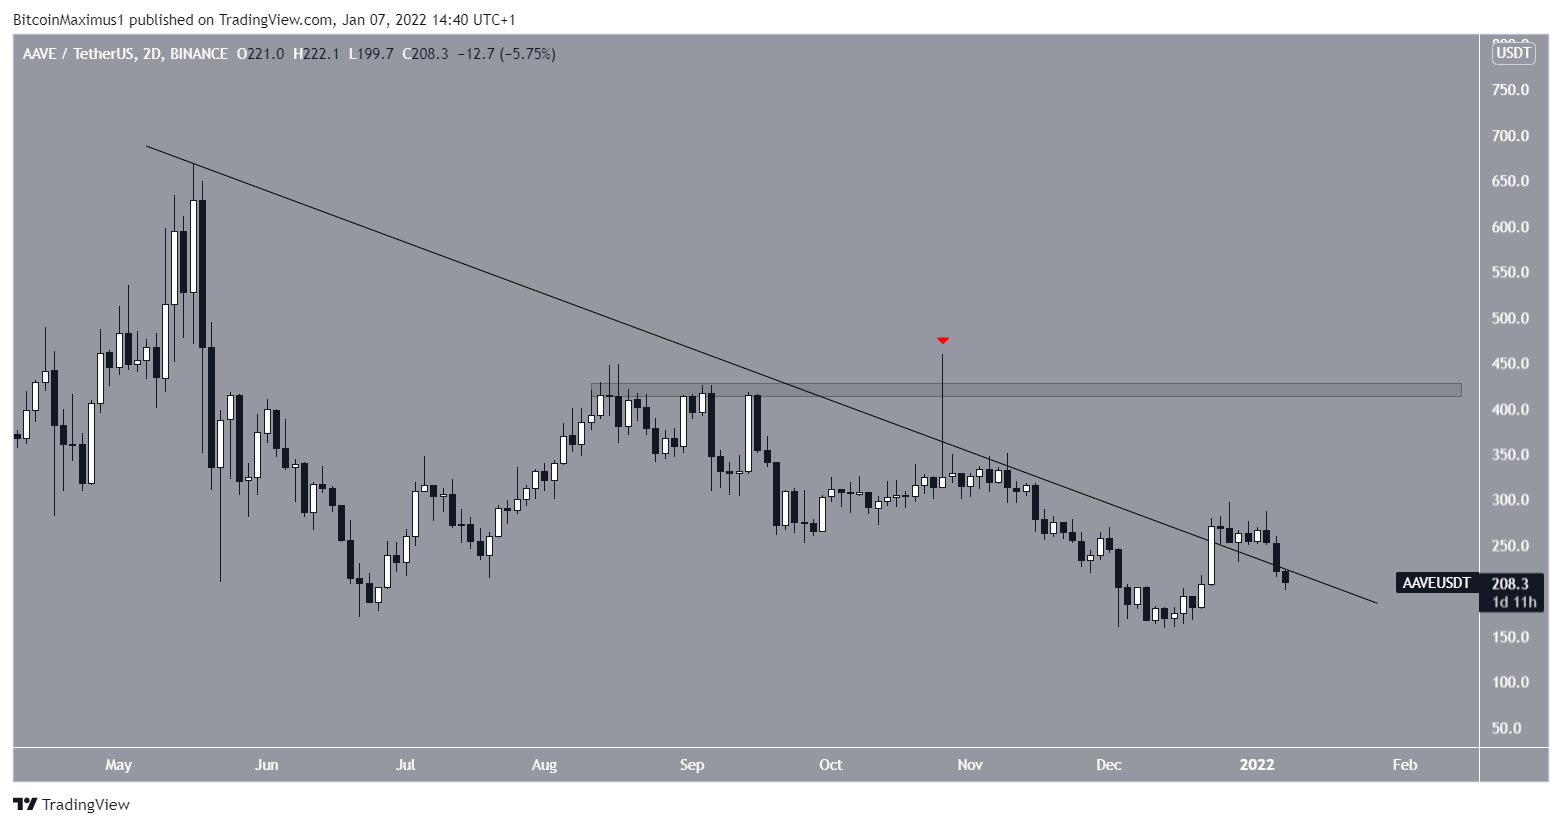
AAVE has been decreasing alongside a descending resistance line since May 18.
On Oct 27, it made an attempt at breaking out, but was rejected by the $410 horizontal resistance area and created a long upper wick (red icon).
Similarly, on Dec 25 – 30, it made another breakout attempt but is back trading below this line.
The trend cannot be considered bullish until AAVE decisively moves above this line.
IOTA
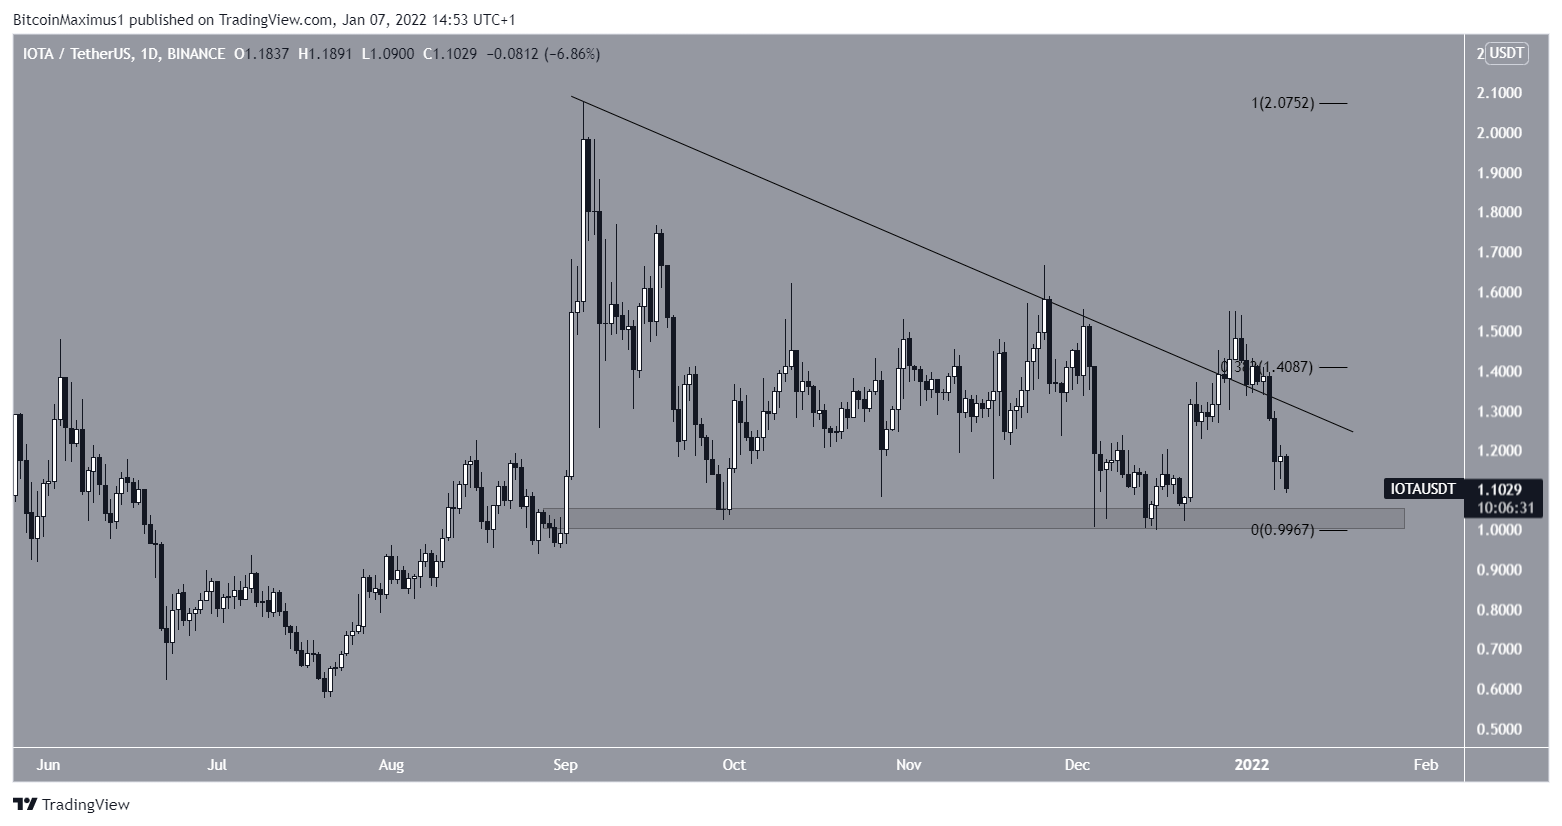
IOTA has been decreasing alongside a descending resistance line since Sept 4. Similarly to AAVE, it seemed like IOTA broke out from this line on Dec 31. However, it has fallen back below it, and it now risks breaking down below the $1.05 support area.
This could greatly accelerate the rate of decrease.
GNO
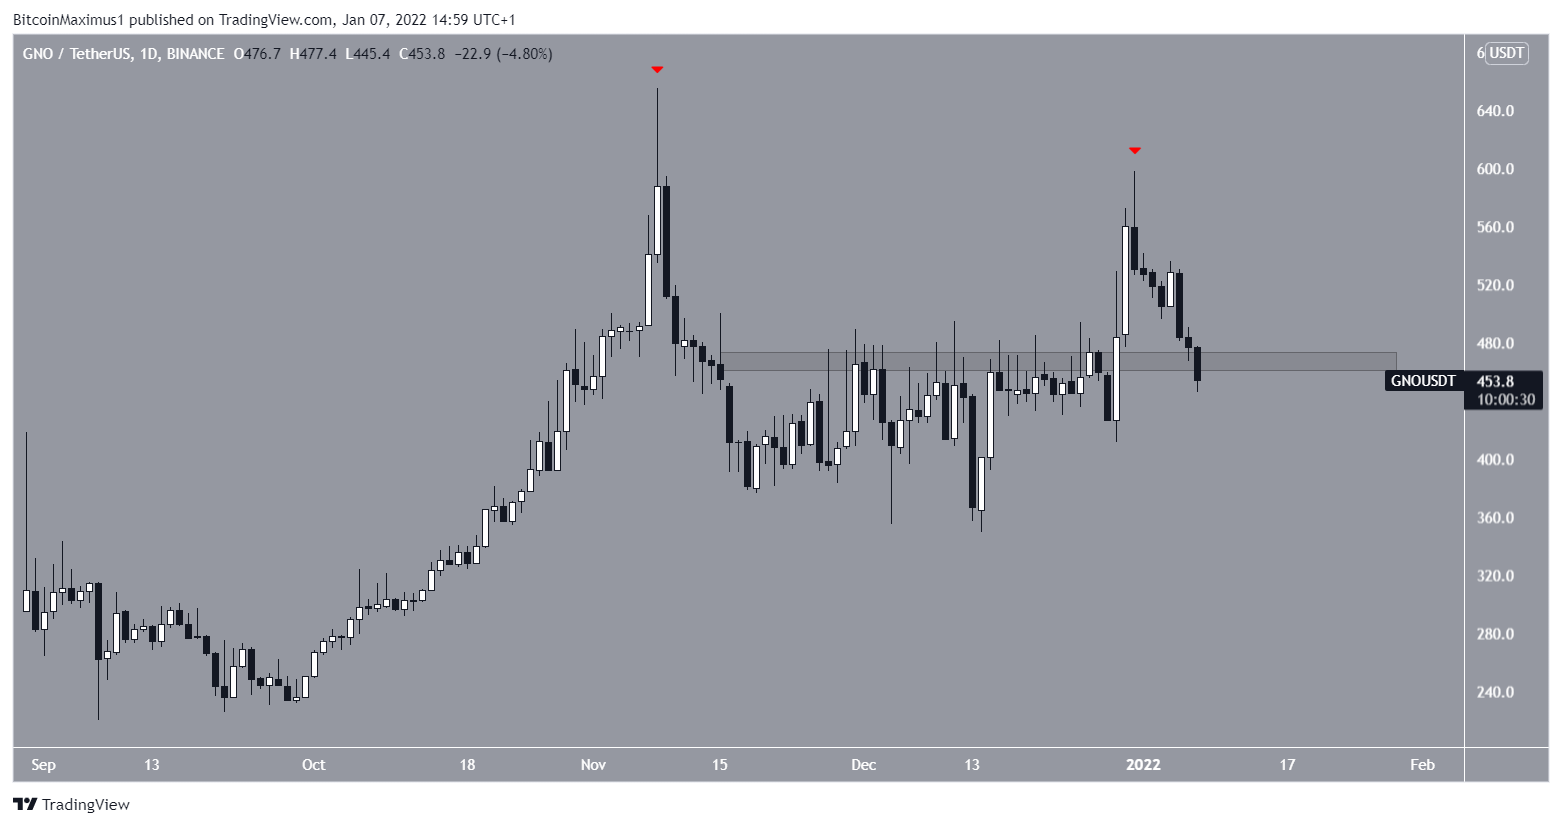
On Nov 8, GNO reached an all-time high of $65 . After a drop, it increased throughout Dec, culminating with a high of $598 on Dec 31. This was a lower high (red icons) relative to the Nov one.
GNO is currently in the process of falling below the $470 horizontal area. If it does, this could greatly accelerate the rate of decrease.
 beincrypto.com