
Celestia (TIA) has surged by 21% over the past four days, sparking interest in the sustainability of this upward trend. While the rise is promising, shifts in key indicators raise questions about its strength.
TIA is gaining momentum without entering overbought territory, indicating room for further growth. Additionally, the EMA lines currently show a neutral stance. As market conditions evolve, keeping a close eye on these indicators will be essential to determine if TIA can maintain its recent gains.
TIA ADX Raises an Important Question About the Current Uptrend
Although the TIA price has risen 21% in the last four days, it’s important to check the current trend. The Average Directional Index (ADX) for TIA is currently at 21.33, down from 40.81 just three days ago. This decline suggests that the strength of the current trend is weakening, indicating that the upward momentum may not be as strong as it appears.
ADX readings above 25 typically indicate a strong trend, while values below 20 signal a weak trend. The ADX measures the strength of a trend regardless of its direction, with thresholds of 0-25 indicating a weak trend, 25-50 indicating a strong trend, and above 50 signaling an extremely strong trend.
Read More: 11 Cryptos To Add To Your Portfolio Before Altcoin Season
Given that TIA is presently in an uptrend, the recent drop in ADX raises concerns about potential instability. As such, it’s crucial to continuously monitor the ADX to assess whether this upward momentum can be sustained and if the price will keep growing.
With the ADX at 21.33, it’s positioned on the cusp of a weak trend, highlighting the importance of vigilance in observing how market conditions evolve in the coming days. This will help determine if TIA can maintain its recent gains or if a pullback is imminent.
Celestia RSI Is Far From Overbought State
TIA’s Relative Strength Index (RSI) is currently at 56.89, rising from roughly 31 just three days ago. This significant increase matters because it suggests a shift in momentum. That indicates that TIA price is gaining strength after a period of relative weakness.
The RSI is a momentum oscillator that measures the speed and change of price movements, ranging from 0 to 100. An RSI below 30 generally indicates an oversold asset, while an RSI above 70 suggests it’s overbought.
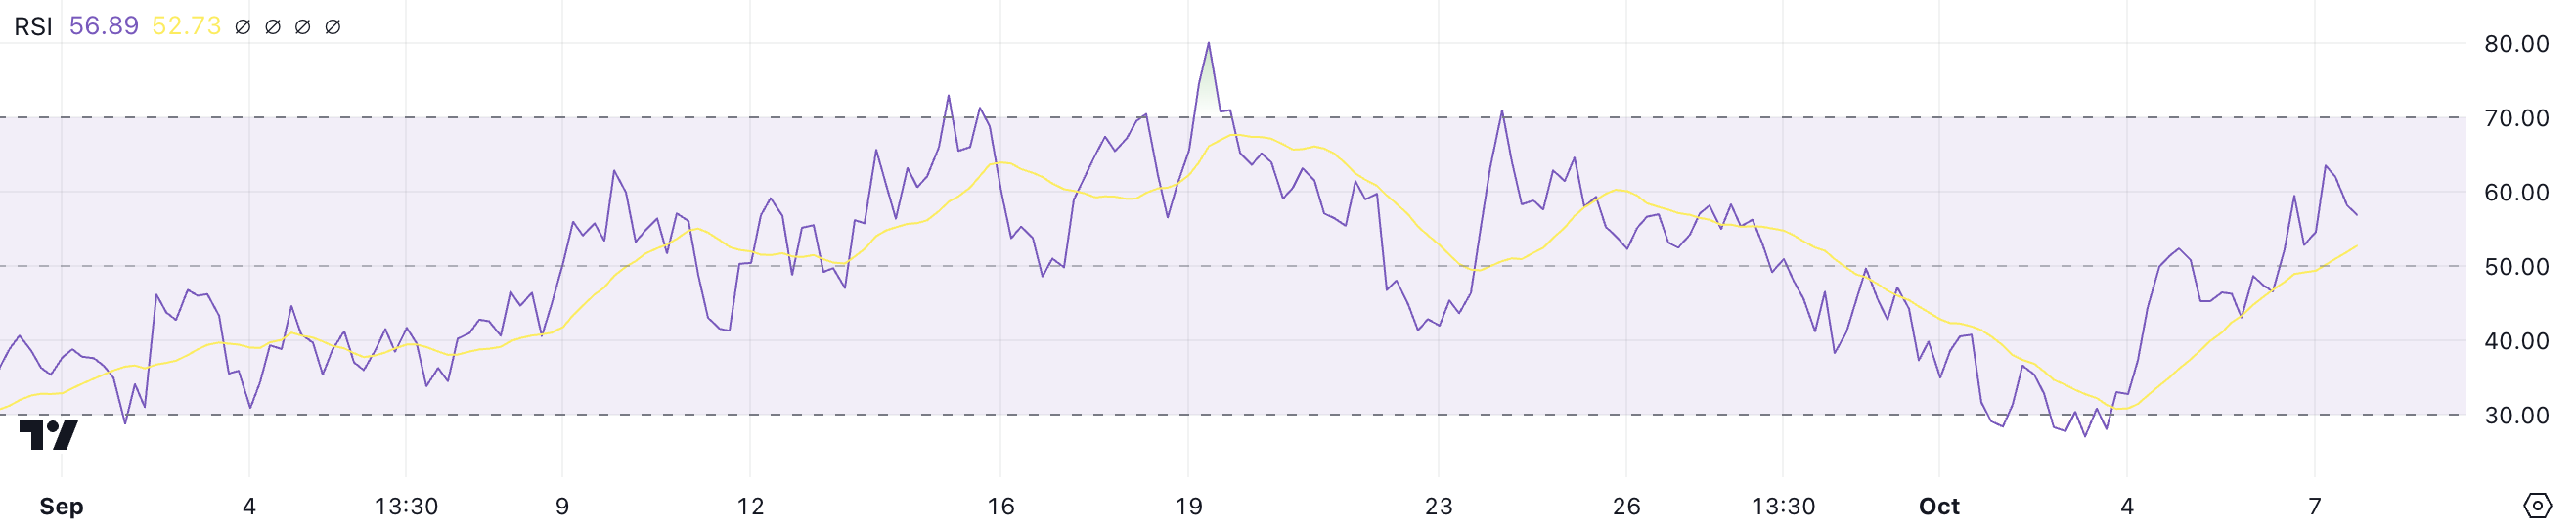
TIA’s current RSI of 56.89 comfortably stays below the overbought threshold. That implies that there is potential for further price growth. Monitoring the RSI closely will provide insights into whether TIA can sustain this positive trend without entering an overbought condition.
TIA Price Prediction: A Potential 26% Rise Next?
TIA’s Exponential Moving Average (EMA) lines are currently looking neutral, with short-term lines on the rise and nearing a crossover above the long-term lines. This indicates that recent price action is becoming more bullish, suggesting a potential shift in momentum.
If the short-term EMA lines cross above the long-term lines, they will form a “golden cross,” a pattern often linked to the start of a strong uptrend. This signals that recent prices are gaining momentum relative to the longer-term trend, which can boost investor confidence.
EMA lines, unlike simple moving averages, give more weight to recent prices, making them more responsive to new information. This responsiveness can provide early signals of trend changes, making the golden cross an important indicator for potential price growth.
Read more: 10 Best Altcoin Exchanges In 2024
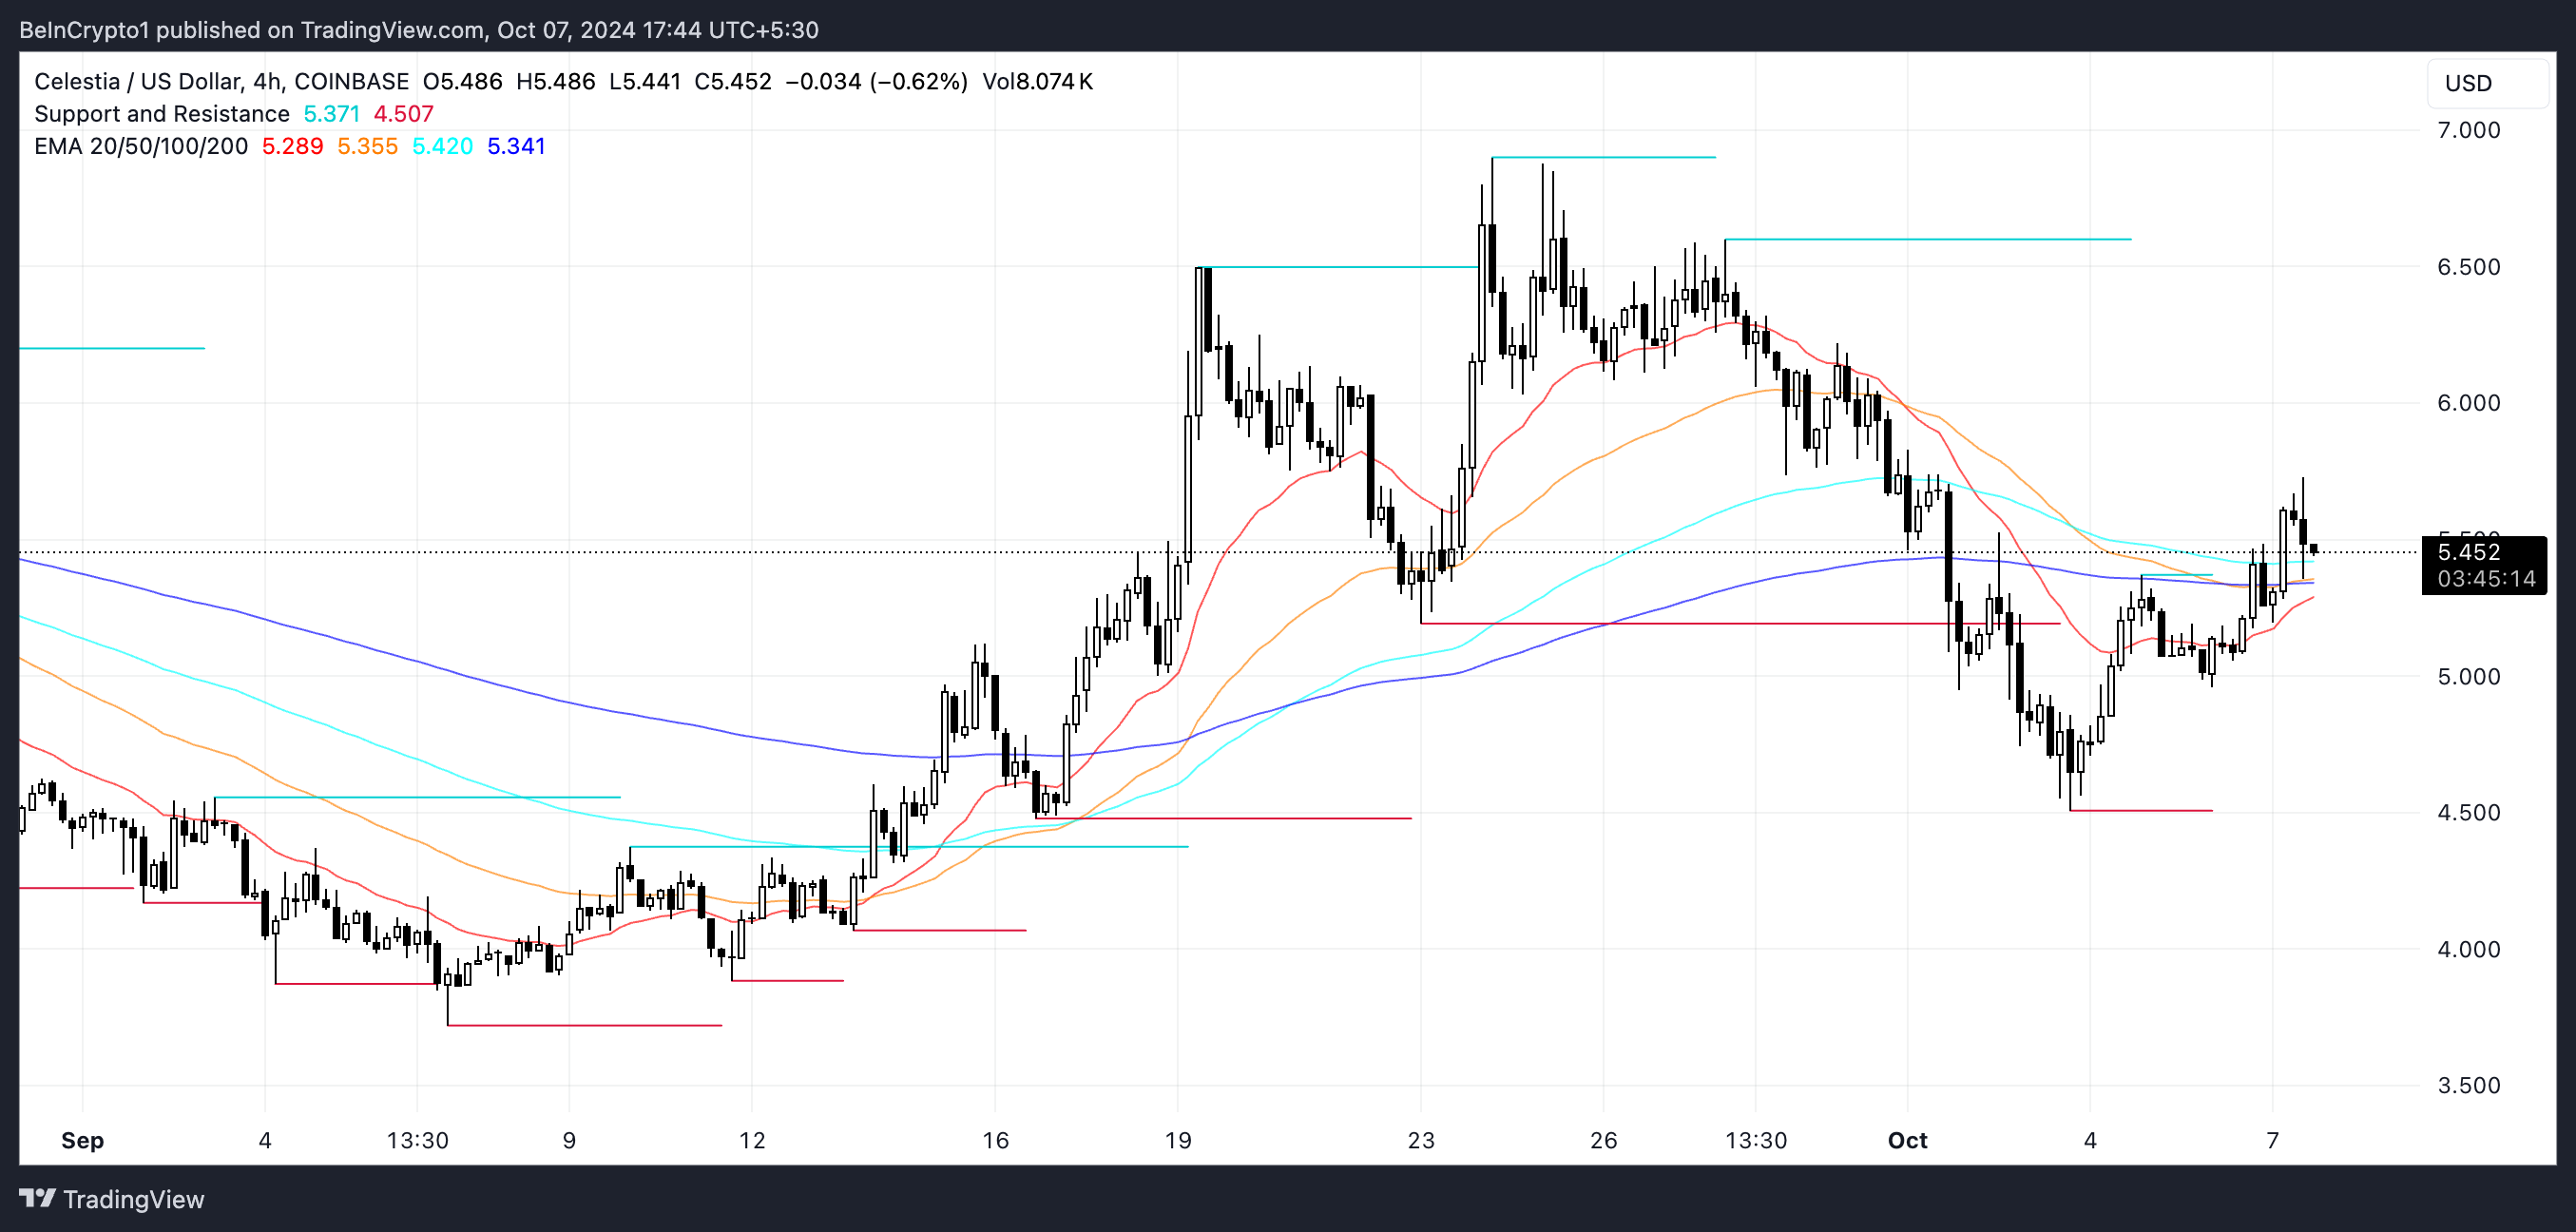
If TIA does indeed experience an uptrend following a golden cross, the next resistance levels to watch will be at $6.49 and $6.60. If those levels are broken, TIA could potentially rise even further to test $6.89, indicating a possible 26% growth from current levels.
Conversely, if the anticipated uptrend does not materialize and a downtrend occurs instead, TIA’s price could test $5.19 as a support level. Should this support fail to hold, the price could decline further to around $4.49, representing a potential 18% drop.