XRP’s value has dropped by 17% over the past week, fueled by the broader market downturn and further impacted by the US SEC’s decision to file an appeal against Ripple.
Although buying pressure has weakened significantly over the past few days, traders in the XRP derivatives market remain optimistic. This analysis explores whether or not the bets of these traders will produce favorable results in the near term.
Ripple Long Traders Double Down
Despite the broader market downturn and the ongoing legal battle between the US SEC and Ripple, XRP derivatives traders maintain a bullish outlook. Long positions continue to dominate, reflecting investor optimism about XRP’s price potential.
This sentiment is supported by the token’s funding rate, which has consistently stayed positive. As of now, the funding rate is at 0.004%, indicating sustained confidence in XRP’s future growth.
Read more: XRP ETF Explained: What It Is and How It Works
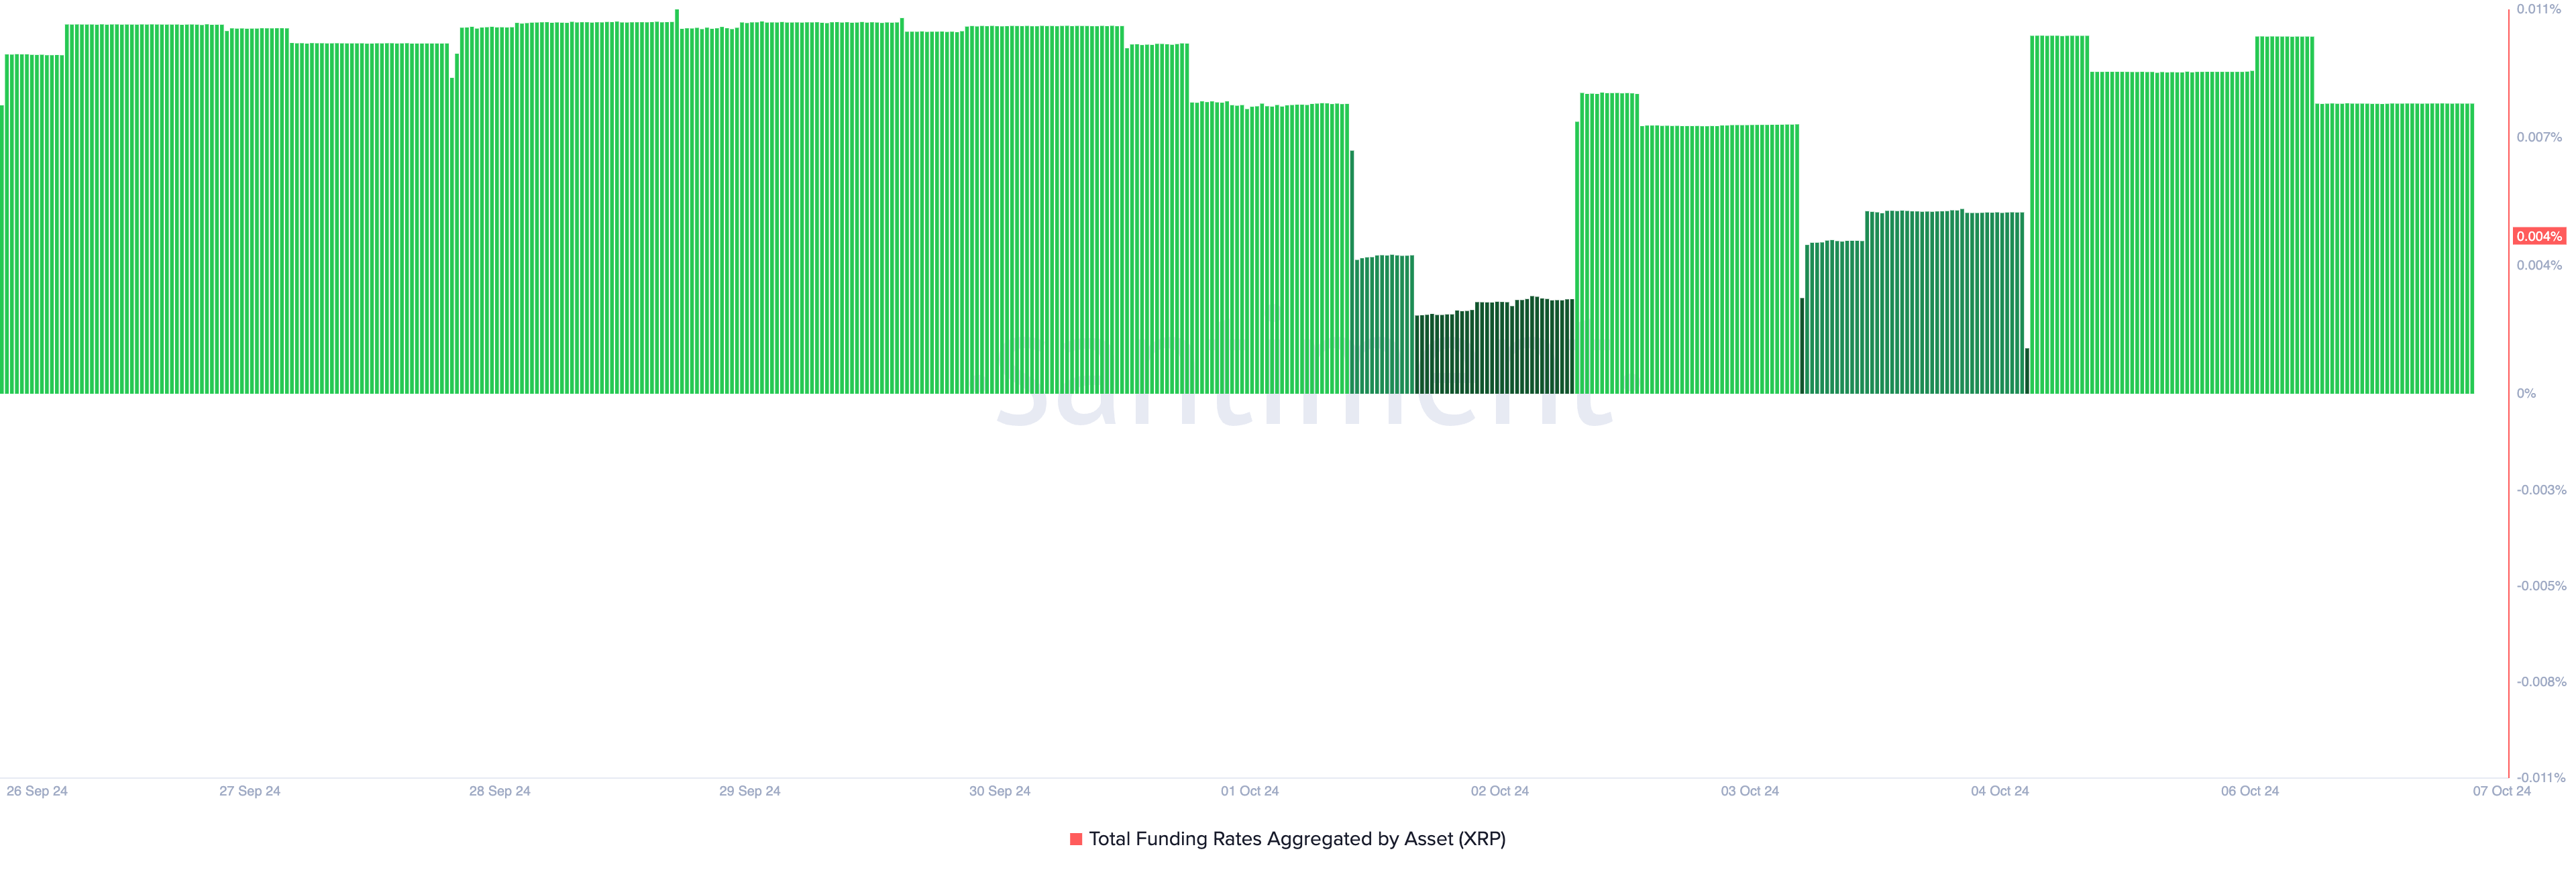
A positive funding rate suggests a higher demand for long positions than short ones in the market. It occurs when traders are optimistic about an asset’s future price increases and, as a result, are willing to pay a premium to maintain their long positions.
However, XRP spot traders do not share this stance. They continue to sell their holdings amid fear of a significant price decline once the hearing of the US SEC appeal commences. The token’s negative Chaikin Money Flow (CMF) confirms the strengthening selling pressure.
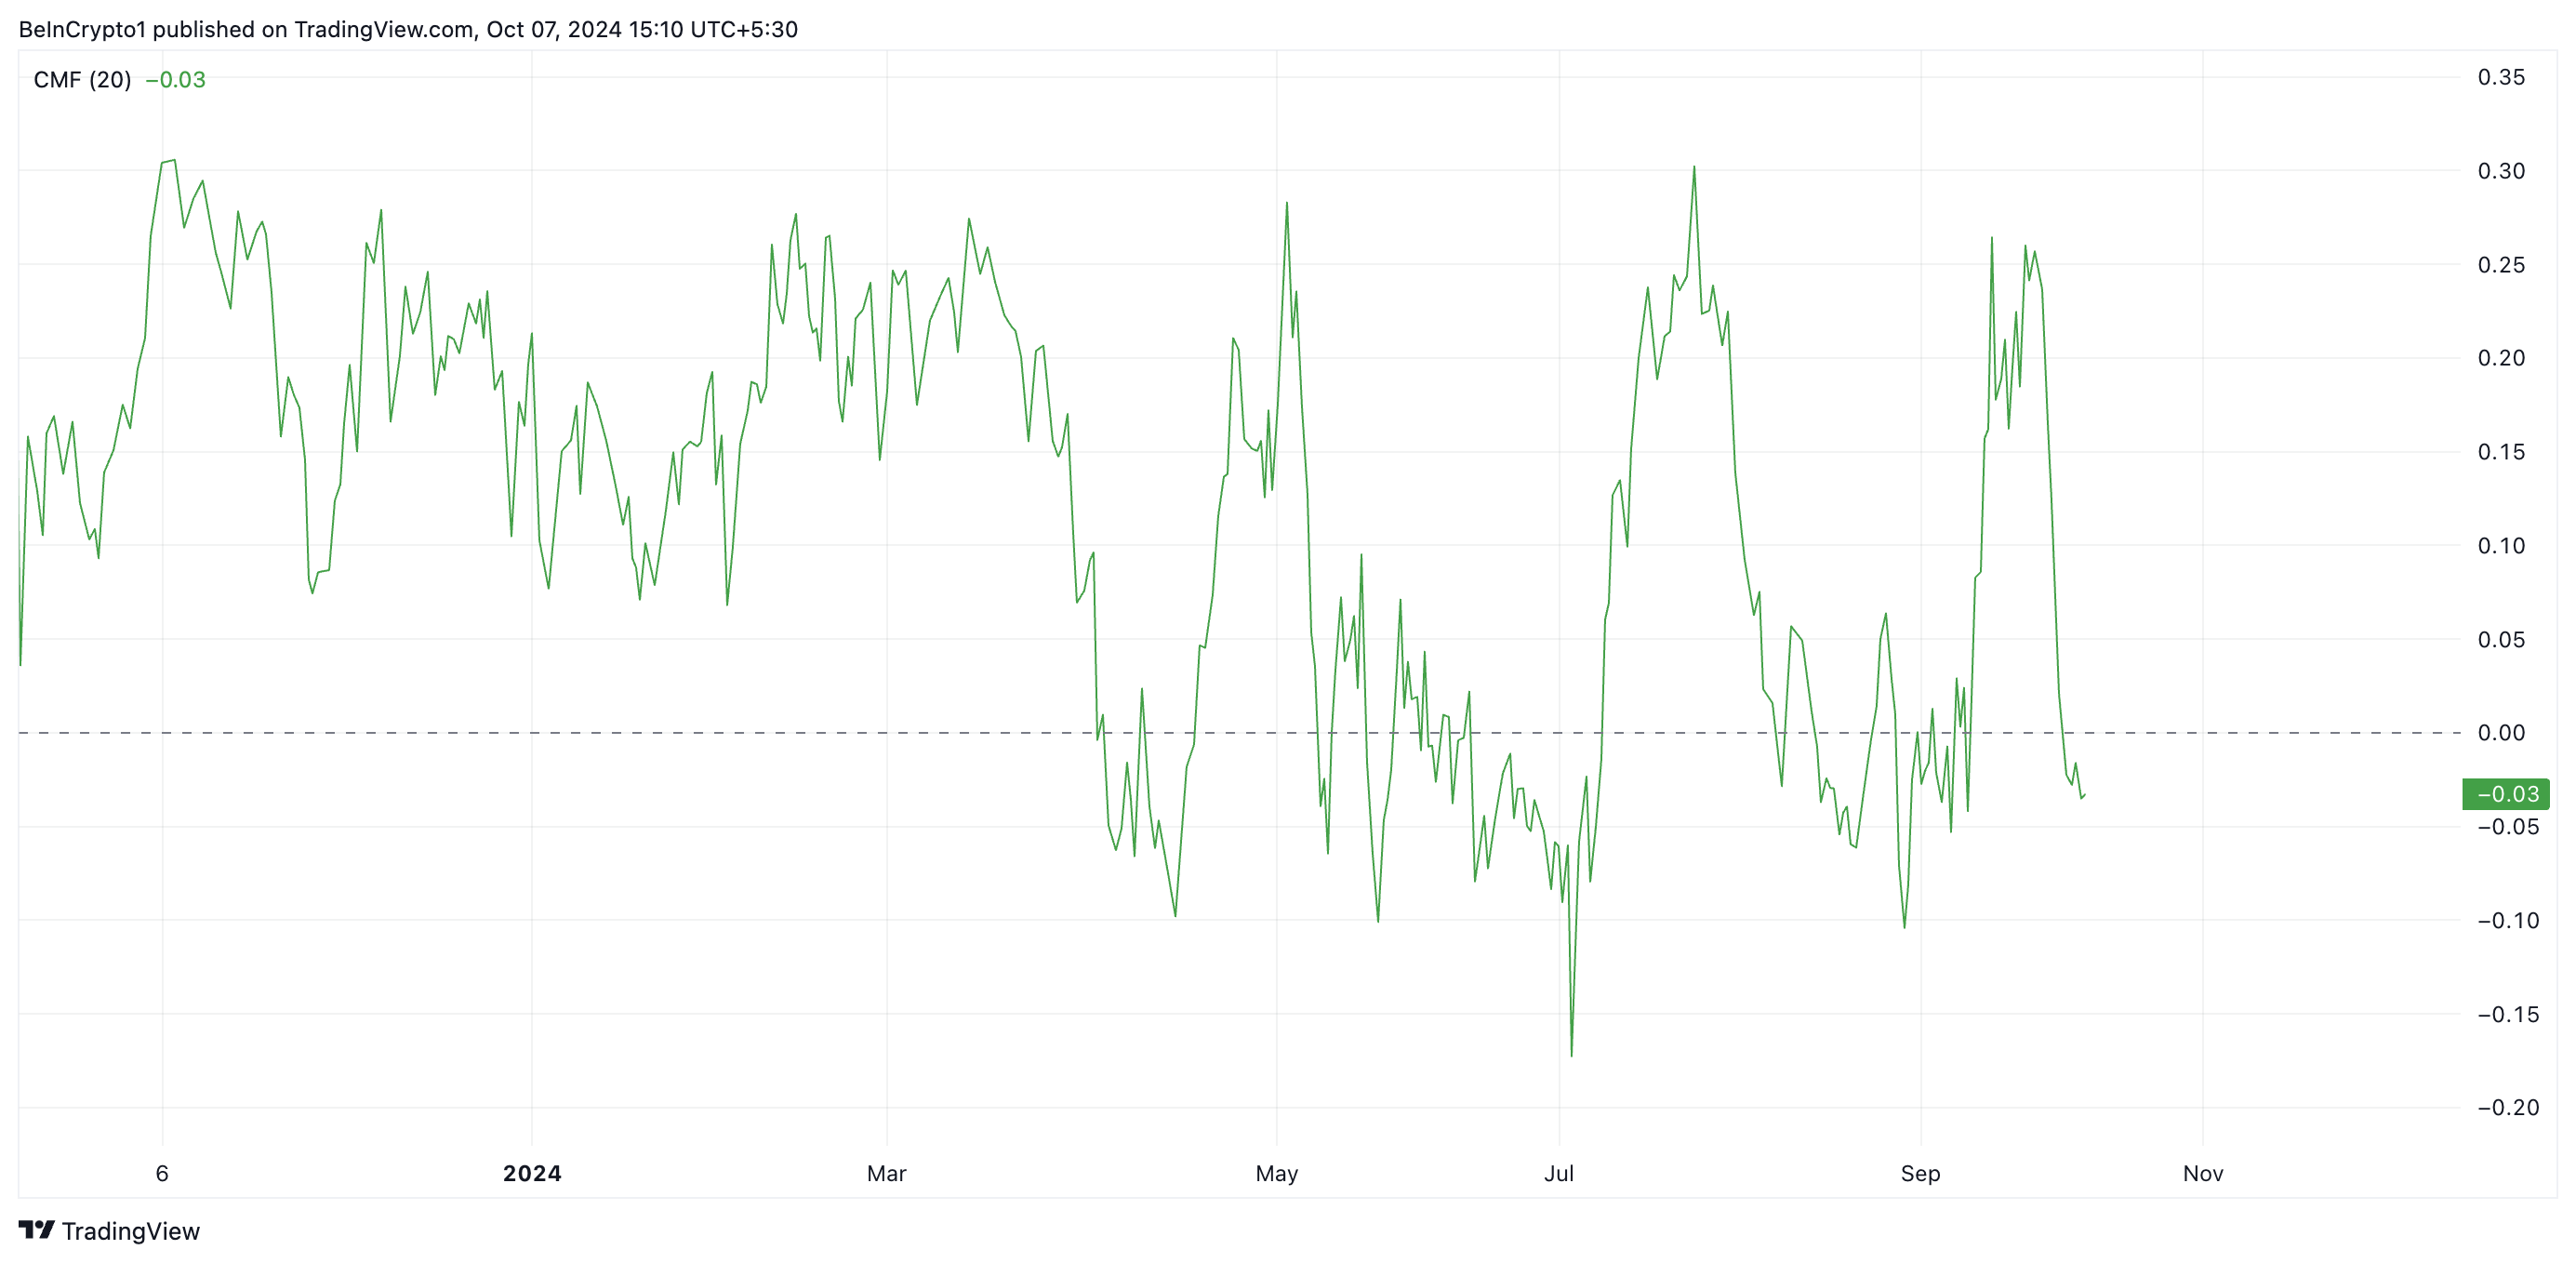
As of this writing, XRP’s CMF is below the zero line at -0.03. This indicator measures money flows into and out of an asset. When its value is below zero, selling pressure is high as traders remove liquidity from the market to prevent further investment losses.
XRP Price Prediction: Token Trades Below Key Moving Averages
XRP is currently trading below its 20-day exponential moving average (EMA) and its 50-day simple moving average (SMA). The 20-day EMA is a short-term indicator that quickly responds to price changes by averaging an asset’s closing price over the past 20 days. In contrast, the 50-day SMA provides a longer-term perspective by tracking the average closing price over 50 days.
These moving averages are key indicators for traders, often marking support and resistance levels. When an asset’s price drops below the 20-day EMA, it suggests a potential shift in momentum, possibly leading to further declines. A drop below the 50-day SMA typically confirms a bearish trend.
Read more: Ripple (XRP) Price Prediction 2024/2025/2030
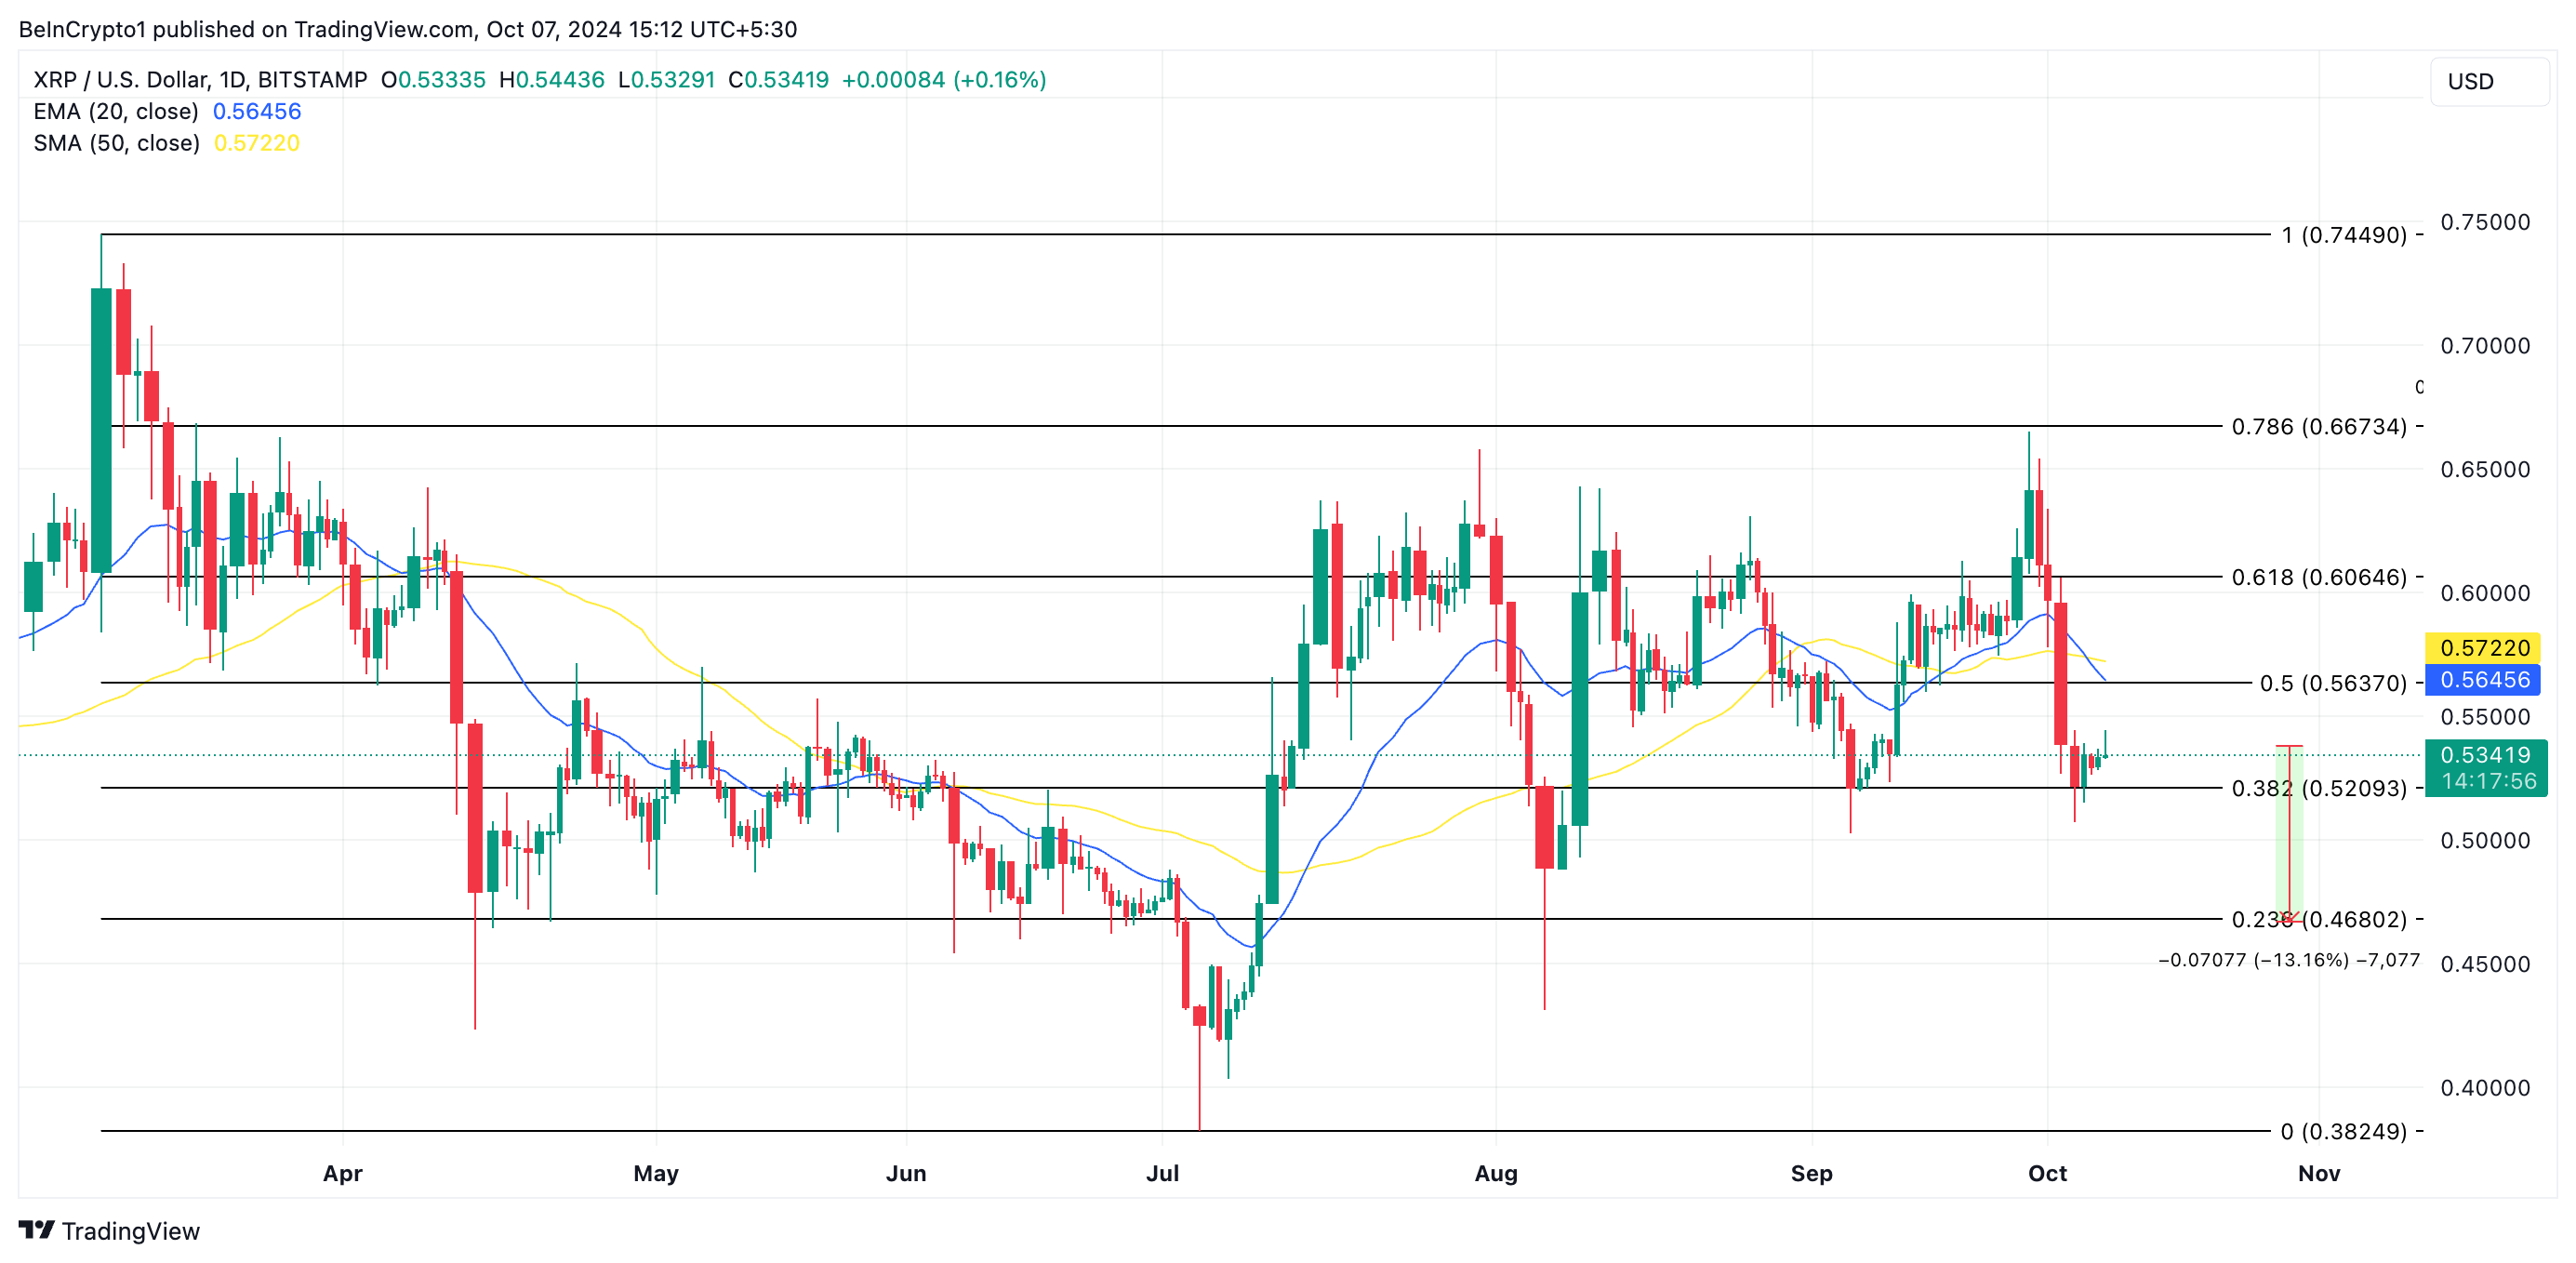
XRP is facing a potential 13% decline, which could see it drop to $0.46 if it continues to distance itself from these crucial averages. However, if sentiment in the spot market turns positive and demand rises, XRP’s price could rally by 25%, pushing it to $0.66.