
Recent price action is painting a bearish picture for $FET, with the Relative Strength Index (RSI) signaling the potential for further declines. As the RSI hovers in bearish territory, the momentum seems to be favoring sellers, raising concerns of a deeper downturn.
In the midst of the intensifying downside pressure, attention is shifting to the critical $0.9 support level. Holding this level is crucial for avoiding additional losses, as a breakdown could lead to more significant declines.
With current market sentiment suggesting more losses may be in store, this article aims to analyze the ongoing bearish extension in $FET, focusing on how the RSI signals increased bearish pressure. By examining key technical indicators and market trends, this piece will explore whether $FET is likely to experience more declines or if any potential support levels could trigger a rebound.
RSI Signals Growing Downside Momentum For $FET
$FET has recently shifted into bearish territory on the 4-hour chart, slipping below the 100-day Simple Moving Average (SMA) and heading toward the critical $0.9 support level. This decline below the 100-day SMA signals weakening momentum, with sellers gaining control over the market.
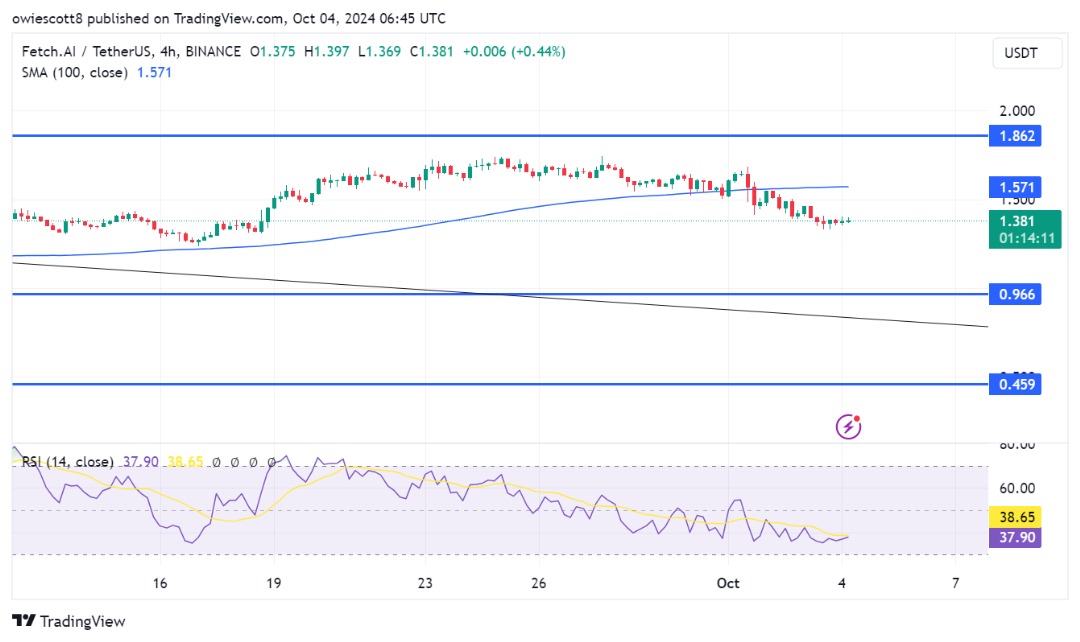
An analysis of the 4-hour Relative Strength Index reveals that the signal line has decreased below 50%, and it is currently at 37%, reflecting increased selling pressure and diminishing buying interest. With the RSI in this territory, this points to the possibility of further downside movement for $FET, highlighting a lack of bullish conviction in the market.
Furthermore, $FET on the daily chart is displaying negative momentum after struggling to surpass the $1.8 resistance level. This struggle is highlighted by the formation of multiple bearish candlesticks, signaling persistent selling pressure in the market. Although the price remains above the 100-day SMA, which typically indicates a bullish trend, the inability to break through the $1.8 resistance suggests that upbeat strength is weakening, and $FET could be poised for extended losses.
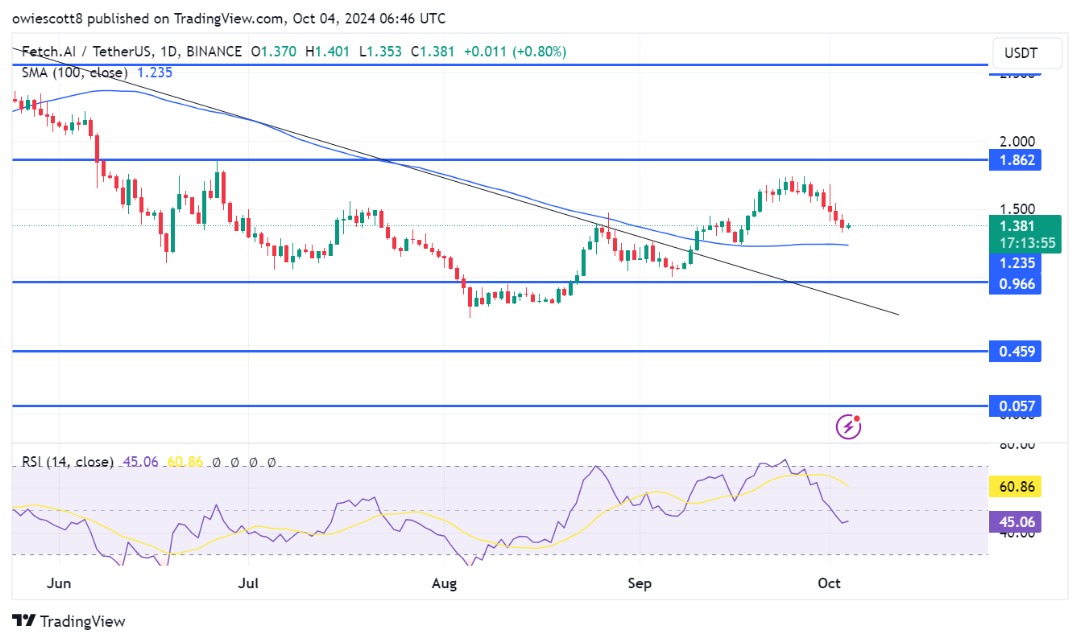
A closer examination of the RSI formation on the 1-day chart indicates that the RSI signal line has dropped to 44%, recently falling below the important 50% threshold. Typically, an RSI reading below 50 suggests a bearish sentiment, indicating that the asset is losing steam. Such a decline could signal potential deeper corrections for $FET unless a reversal is observed.
Key Support Levels To Watch Amid Bearish Sentiment
With bearish sentiment prevailing in the market, the $0.9 support level has become particularly crucial for $FET. A breach below this level could ignite heightened selling pressure, possibly driving the price down toward the $0.4 support mark and beyond.
If $FET can maintain its strength and stay above the $0.9 support level, it may pave the way for a rebound, allowing the price to drift back toward the $1.8 resistance zone. A successful breakout above this key resistance level could spark a surge in buying activity, resulting in further gains as bullish momentum builds. Observing how $FET reacts to these levels will be crucial, as they will indicate whether a recovery is on the horizon or if bearish pressure will reassert itself.