The price of Solana (SOL) has fallen to $141.74 after a 3.2% drop in the last 24 hours, leading investors to question whether the cryptocurrency has reached its bottom. Technical indicators also present mixed signals on SOL’s future price action.
Traders are closely monitoring Solana’s price action for signs of a potential reversal or further decline.
SOL Price Trend and Market Activity
Solana’s price trend shows weakening momentum. After reaching a high of $146.44, the price started falling, showing a loss in bullish strength. Despite some upward movement, SOL has struggled to hold gains, falling back toward the $142 mark.
Read also: Analyst Says SOL Will Hit 20% of ETH’s Market Cap in Next Bull Rally
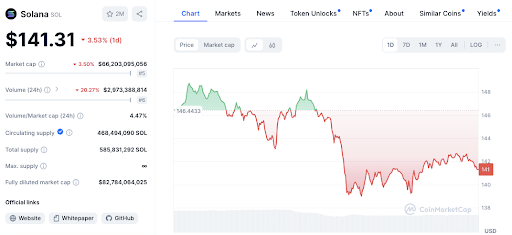
Significantly, trading volume has decreased by over 20%, suggesting a slowdown in market activity. This decline suggests that traders are becoming more cautious, which could cause further price dips if the trend continues.
Key Support and Resistance Levels to Watch
The near-term support level for SOL is $142, where the price is currently hovering. If SOL falls below this point, the next support level is $140, which could be an important area for traders looking to assess further downside risks.
On the upside, resistance lies at $146.44, the most recent peak. Should Solana manage to break through this level, it could signal a resurgence in bullish sentiment. An intermediate resistance at $144, which SOL briefly tested, also plays a role in determining the cryptocurrency’s short-term price action.
Over the past 12 hours, there have been more short liquidations than long liquidations for Solana. Early in the period, long liquidations outpaced short liquidations during upward price movements.
Read also: Will Solana (SOL) Hit a Good Spike Following the Market Rekt?
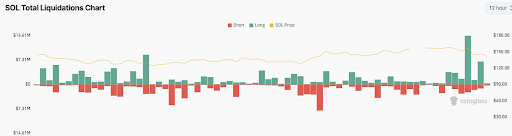
However, as the price began to fluctuate, there was a noticeable increase in short liquidations when the price dipped. Later on, there was a surge in long liquidations as the price recovered, showing heightened volatility as traders took positions on both sides of the market. This volatility indicates uncertainty, as participants react to the rapid price swings.
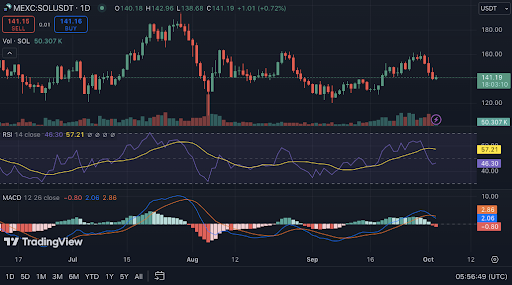
The 1-day RSI for SOL is currently 46.55, which suggests selling pressure but is not yet in oversold territory. Also, the 1-day MACD is trading below the signal line, suggesting a short-term bearish trend.
Disclaimer: The information presented in this article is for informational and educational purposes only. The article does not constitute financial advice or advice of any kind. Coin Edition is not responsible for any losses incurred as a result of the utilization of content, products, or services mentioned. Readers are advised to exercise caution before taking any action related to the company.