Analysts and investors are questioning the sustainability of the recent surge. Despite the initial rally, Cardano’s price failed to close above a key resistance level, signaling potential weakness in the uptrend.
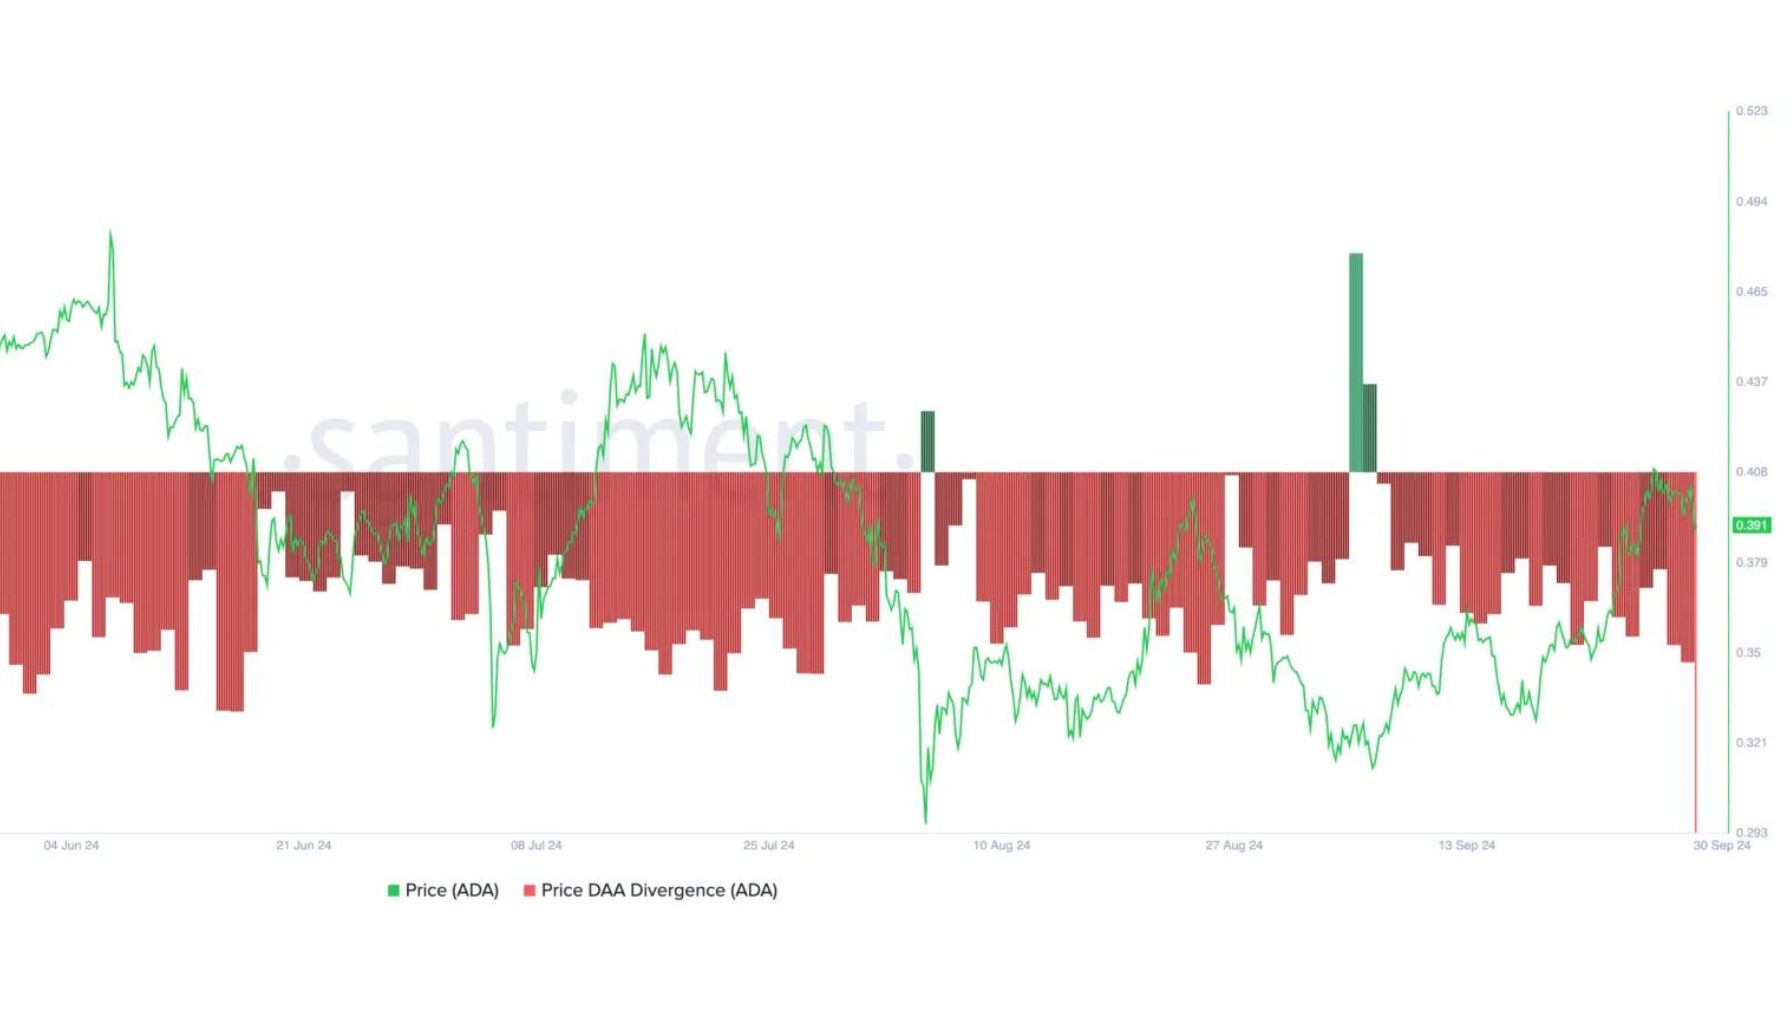
On-chain data from Santiment reveals a decline in demand for $ADA, adding to investor caution. Decreased network activity and buying pressure raise doubts about the sustainability of the current rally.
As the market awaits further developments, investors are closely watching for signs of a reversal or continuation of the uptrend, understanding that $ADA’s next move could set the tone for its performance in the weeks ahead.
Cardano Indicator Shows Concerning Data
Cardano faces a significant risk of a 30% drop to its yearly low of around $0.27, as on-chain data from Santiment reveals rising selling pressure and diminishing demand.
The warning signs for $ADA’s price have become clearer, with its daily active-address (DAA) divergence showing a negative reading of -43.3% at the time of writing. This metric, which tracks the correlation between an asset’s price movements and changes in its daily active addresses, has remained negative since September 7, indicating a troubling trend for Cardano.

The negative DAA divergence suggests that much of $ADA’s rally this month, following the Federal Reserve’s interest rate cuts, has been fueled more by broader market sentiment than by any specific demand for $ADA itself. This lack of organic demand increases the likelihood of a steep correction shortly.
Without sustained buying pressure, Cardano’s price could drop sharply as traders begin to lock in profits, further driving prices downward.
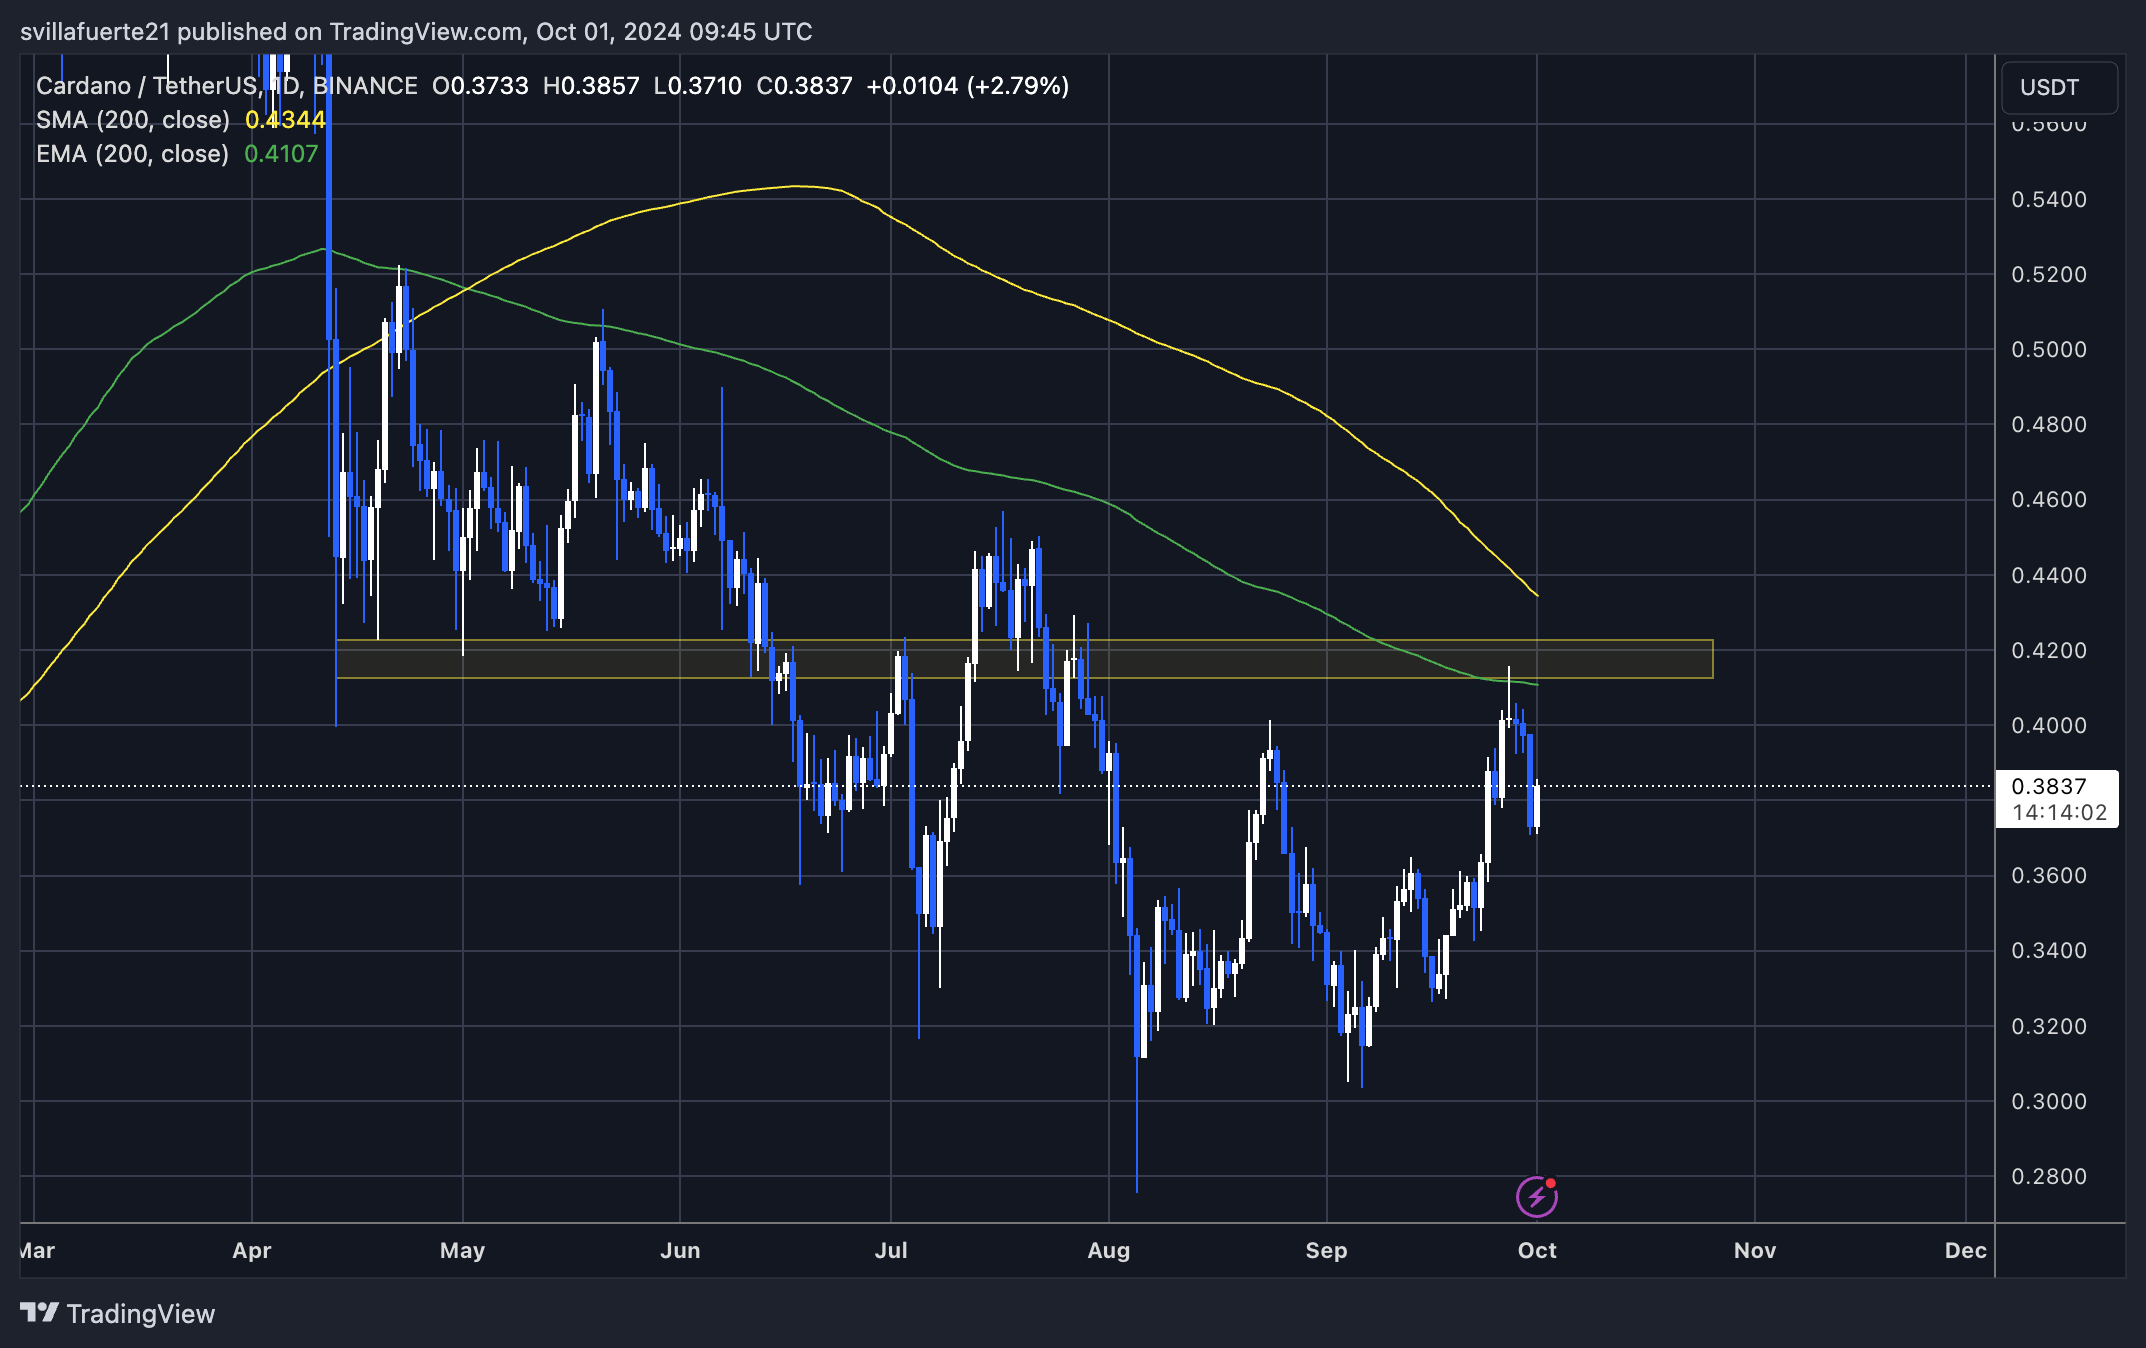
If $ADA fails to break above its current resistance level of around $0.41, analysts expect a deeper correction, potentially pushing the price back to the yearly low of $0.27. With weakening demand and increasing selling pressure, Cardano’s near-term outlook looks uncertain, and traders are bracing for further downside risk.
$ADA Price Action: Testing A Crucial Supply Level
$ADA trades at $0.38, following a 10% dip from its daily 200 exponential moving average (EMA) at $0.41. This level has become a crucial resistance area, as the price formed a new local high around this zone.
$ADA must reclaim the $0.41 level and push above the next key resistance at $0.45 to confirm a bullish trend for the coming weeks. Successfully breaking past these levels would signal renewed strength, giving the bulls control and potentially leading to higher prices.

However, if $ADA fails to push above these critical levels, the altcoin could face further downside pressure. A failure to reclaim $0.41 and surpass $0.45 would likely result in increased selling, triggering a potential 30% drop. In such a scenario, $ADA would be at risk of revisiting its yearly low of around $0.27.
Given the current market uncertainty and declining demand, traders are carefully watching $ADA’s price movements, as the next few days could be pivotal for determining whether a bullish breakout or a deeper correction is on the horizon.
Featured image from Dall-E, chart from TradingView
 newsbtc.com
