Key takeaways:
- Our Aptos price prediction anticipates a high of $7.69 by the end of 2024.
- In 2025, it will range between $11.27 and $13.13, with an average price of $11.59.
- In 2030, it will range between $71.06 and $85.03, with an average price of $73.60.
Aptos has aggressively attracted capital into its ecosystem. The network has a total value locked (TVL) of $545 million, with a stablecoin market capitalization of $212 million.
Aptos is a high-performance layer-1 blockchain with a mature ecosystem comprising a variety of decentralized decentralized finance (DeFi) applications.
Aptos network continues to build decentralized applications and tools for developers. But how about APT’s performance? How high will it go? Is APT a good investment? Let’s explore these questions in our Cryptopolitan price predictions from 2024 to 2030.
Overview
| Cryptocurrency | Aptos |
| Ticker | APT |
| Current price | $7.68 |
| Market cap | $3.827 billion |
| Trading volume | $319.35 million |
| Circulating supply | 502,075,369 |
| All-time high | $19.90 on Jan 30, 2023 |
| All-time low | $3.09 on Dec 30, 2022 |
| 24-hour high | $8.36 |
| 24-hour low | $7.36 |
Aptos price prediction: Technical analysis
| Metric | Value |
| Volatility (30-day variation) | 13.50% |
| 50-day SMA | $6.24 |
| 200-day SMA | $8.50 |
| Sentiment | Neutral |
| Fear and Greed Index | 50 (Neutral) |
| Green days | 16/30 (53%) |
Aptos price analysis
Aptos, one of last week’s biggest winners, recently announced new investment funding from venture firms, raising approximately $350M.
At press time, Aptos traded at $7.63, reflecting a daily 3.65% loss. The price chart shows Aptos’ could be ahead of a heading for a retest after a daily breakout.
Since topping out in March this year, the Aptos price has oscillated within a downward channel-like pattern, testing the range bound period’s upper and lower trendlines on multiple occasions.
Last week, it broke bullish from the descending channel and the subsequent range. The month’s rally from the channel’s average pushed the coin to a monthly high of $8.47.
Aptos 1-day chart price analysis
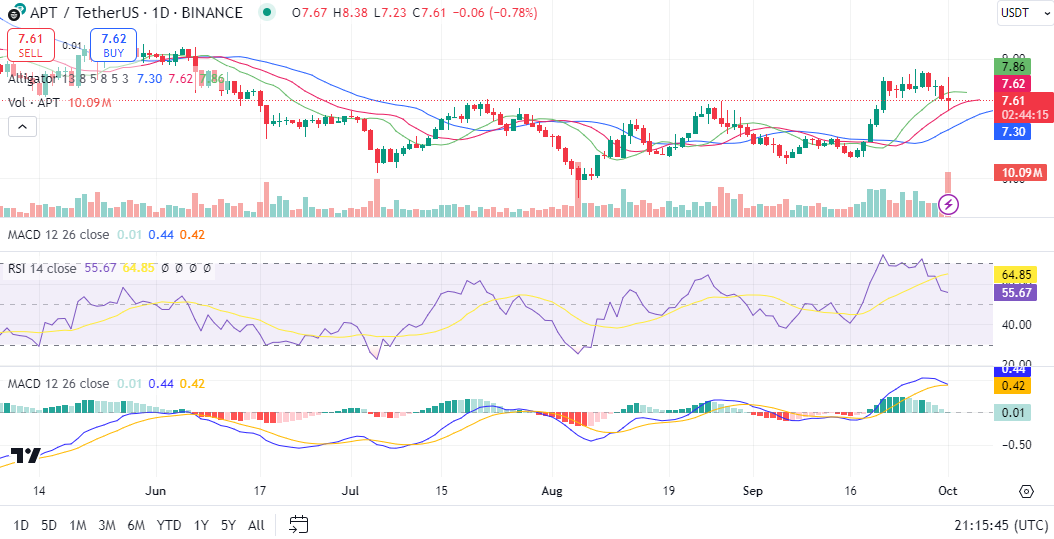
Aptos has been range bound in the last two months, oscillating between $4.96 and $7.31, but it broke out upwards last week, rising above $7.5. The William Alligator is feeding, signaling high market volatility, while the relative strength index has reversed from overbought territory. The MACD indicator registers slowing positive market momentum.
If Apto’s price continues to grind higher, watch the $8.50 level on the chart at the channel’s upper trendline. The cryptocurrency could find resistance near a range of narrow consolidation.
Investors should monitor the $5.80 level upon a downside reversal. A rally into this area would likely face support from last month’s low and the flattening 200-day EMA.
Aptos technical indicators: Levels and action
Daily simple moving average (SMA)
| Period | Value ($) | Action |
| SMA 3 | 7.20 | BUY |
| SMA 5 | 7.66 | SELL |
| SMA 10 | 7.89 | SELL |
| SMA 21 | 7.13 | BUY |
| SMA 50 | 6.74 | BUY |
| SMA 100 | 6.62 | BUY |
| SMA 200 | 8.50 | SELL |
Daily exponential moving average (EMA)
| Period | Value ($) | Action |
| EMA 3 | 7.15 | BUY |
| EMA 5 | 6.86 | BUY |
| EMA 10 | 6.55 | BUY |
| EMA 21 | 6.37 | BUY |
| EMA 50 | 6.55 | BUY |
| EMA 100 | 7.25 | BUY |
| EMA 200 | 8.07 | SELL |
What to expect from Aptos price analysis next?
Our analysis shows bullish current sentiment, while the Fear and Greed Index shows greed among investors. The charts show APT has rising volatility as it breaks above the historical downward channel.
Is Aptos a good investment?
APTOS’s design prioritizes scalability, reliability, and upgradeability. It is notable for using the MOVE programming language, developed by Facebook and now META. While the current trend is bearish, predictions paint a different narrative.
What can we expect from APT price analysis next?
Our analysis shows the current sentiment is bearish, while the Fear and Greed Index shows fear among investors. The charts show APT has little volatility, as it moves into consolidation.
Why is Aptos down?
Aptos has traded in a downward channel since March this year, and the crypto market capitalization is yet to recover to the previous high. The drop in Aptos value could be attributed to the general market sentiment.
Will Aptos recover?
Aptos is currently trading in oversold territory and is ripe for a reversal. The market’s volatility is also rising, suggesting an extended recovery.
Will Aptos reach $10?
Yes, Aptos should rise above $10 in 2025. The move will come as the market recovers to previous highs.
Will Aptos reach $100?
Per the Cryptopolitan price prediction, it remains highly unlikely that Aptos will get to $100 before 2030.
Will Aptos reach $1000?
Per the Cryptopolitan price prediction, it remains highly unlikely that Aptos will get to $1000 before 2030.
Does Aptos have a good long-term future?
According to Cryptopolitan price predictions, Aptos will trade higher in years to come. However, factors like market crashes or difficult regulations could invalidate this bullish theory.
Recent news: Foresight Ventures makes a multimillion deal with Aptos
Foresight Ventures has announced a multimillion-dollar strategic investment in Aptos.
According to a press release, the funding will be used to accelerate product development, enhance liquidity, and support the advancement of Aptos’ scalable and upgradeable Layer1 blockchain infrastructure.
The partnership vision involves both organizations’ commitment to building practical, user-friendly blockchain solutions that will advance Web3 adoption.
Aptos price prediction October 2024
The Aptos price forecast for October is a maximum price of $8.23 and a minimum price of $6.52. The average price for the month will be $7.64.
| Month | Potential low ($) | Potential average ($) | Potential high ($) |
| October | 6.52 | 7.64 | 8.23 |
Aptos price prediction 2024
For the second half of 2024, APT’s price will range between $4.52 and $7.69. The average price for the period will be $5.99.
| Year | Minimum price ($) | Average price ($) | Maximum price ($) |
| 2024 | 5.52 | 5.99 | 7.69 |
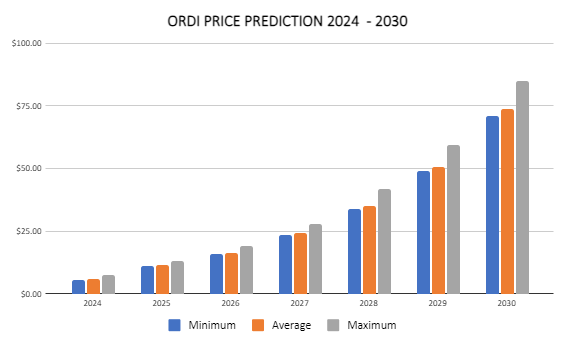
APT price prediction 2025 – 2030
| Year | Potential low ($) | Potential average ($) | Potential high ($) |
| 2025 | 11.27 | 11.59 | 13.13 |
| 2026 | 15.89 | 16.35 | 19.13 |
| 2027 | 23.41 | 24.23 | 27.71 |
| 2028 | 33.99 | 35.20 | 42.01 |
| 2029 | 48.90 | 50.66 | 59.41 |
| 2030 | 71.06 | 73.60 | 85.03 |
Aptos price prediction 2025
The Aptos price prediction for 2025 is a high of $13.13. It will reach a minimum price of $11.27 and an average price of $11.59.
Aptos price prediction 2026
The Aptos price prediction estimates it will range between $15.89 and $19.13, with an average price of $16.35.
Aptos price prediction 2027
Aptos coin price prediction climbs even higher into 2027. According to the predictions, APT’s price will range between $23.41 and $27.71, with an average price of $24.23.
Aptos price prediction 2028
Our analysis indicates a further acceleration in APT’s price. It will trade between $33.99 and $42.01, with an average price of $35.20.
Aptos price prediction 2029
According to the Aptos price prediction for 2029, the price of APT will range between $48.90 and $50.66, with an average price of $59.41.
APT price prediction 2030
According to the Aptos price prediction 2030, the price of Aptos will range between $71.06 and $85.03, with an average price of $73.60.
APT market price prediction: Analysys APT price forecast
| Platform | 2024 | 2025 | 2026 |
| Digitalcoinprice | $11.92 | $15.38 | $20.99 |
| Changelly | $9.83 | $9.89 | $16.35 |
| Gate.io | $6.19 | $7.18 | $7.28 |
Cryptopolitan’s APT price prediction
Our predictions show that APT will achieve a high of $7.69 in the second half of 2024. In 2025, it will range between $11.27 and $13.13, with an average of 11.59. In 2030, it will range between $71.06 and $85.03, with an average price of $73.60. Note the predictions are not investment advice. Seek independent professional consultation or do your research.
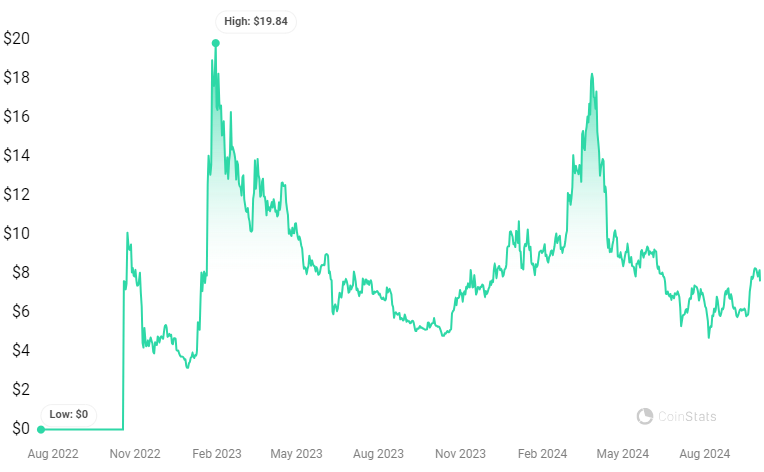
Aptos historic price sentiment
- Aptos raised seed funding in January 2022, led by a16z. Series A funding included Apollo, Dragonfly, Franklin Templeton, and others.
- Some members previously worked on the Diem blockchain proposed by Facebook.
- The Aptos mainnet launched in October 2022 with an initial supply of 1 billion tokens.
- After the launch hype, Apt fell to its lowest in December 2022, at $3.09. A month later, the tables turned, as it peaked at a time high of $19.90 on January 30, 2023.
- It pumped partly driven by the NFT market. Collections such as Aptos Monkeys and Aptomingod have attracted more users.
- On June 6, it fell below its initial listing price and extended the losses in the preceding months.
- In October, it started correcting, rising as high as $8.47 in November.
- In 2024, it broke above $10, reaching $18 in March.
- From April, it reversed, falling below $10. By September, it had fallen as low as $6. It recovered into October, rising above $7.50