Ripple has yet to begin a significant rally since last year, with the market mostly consolidating over the past few months.
However, the recent price action is offering some clues and potential insights as to what the future may hold for XRP.
XRP Price Analysis
By TradingRage
The USDT Paired Chart
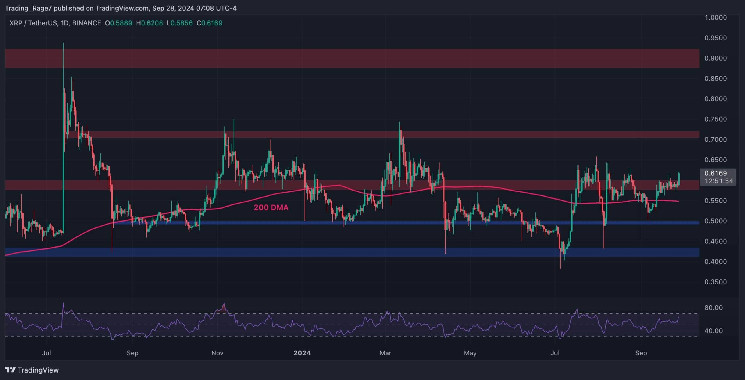
The price has been consolidating around the $0.6 resistance level in recent weeks, following a breakout above the 200-day moving average, which is still located at around $0.55.
However, the market has finally broken the $0.6 level to the upside and seems likely to rally toward $0.72 if the breakout does not fail. The RSI also shows values above 50%, which indicates that the momentum is bullish and a continuation higher is still expected.

The BTC Paired Chart
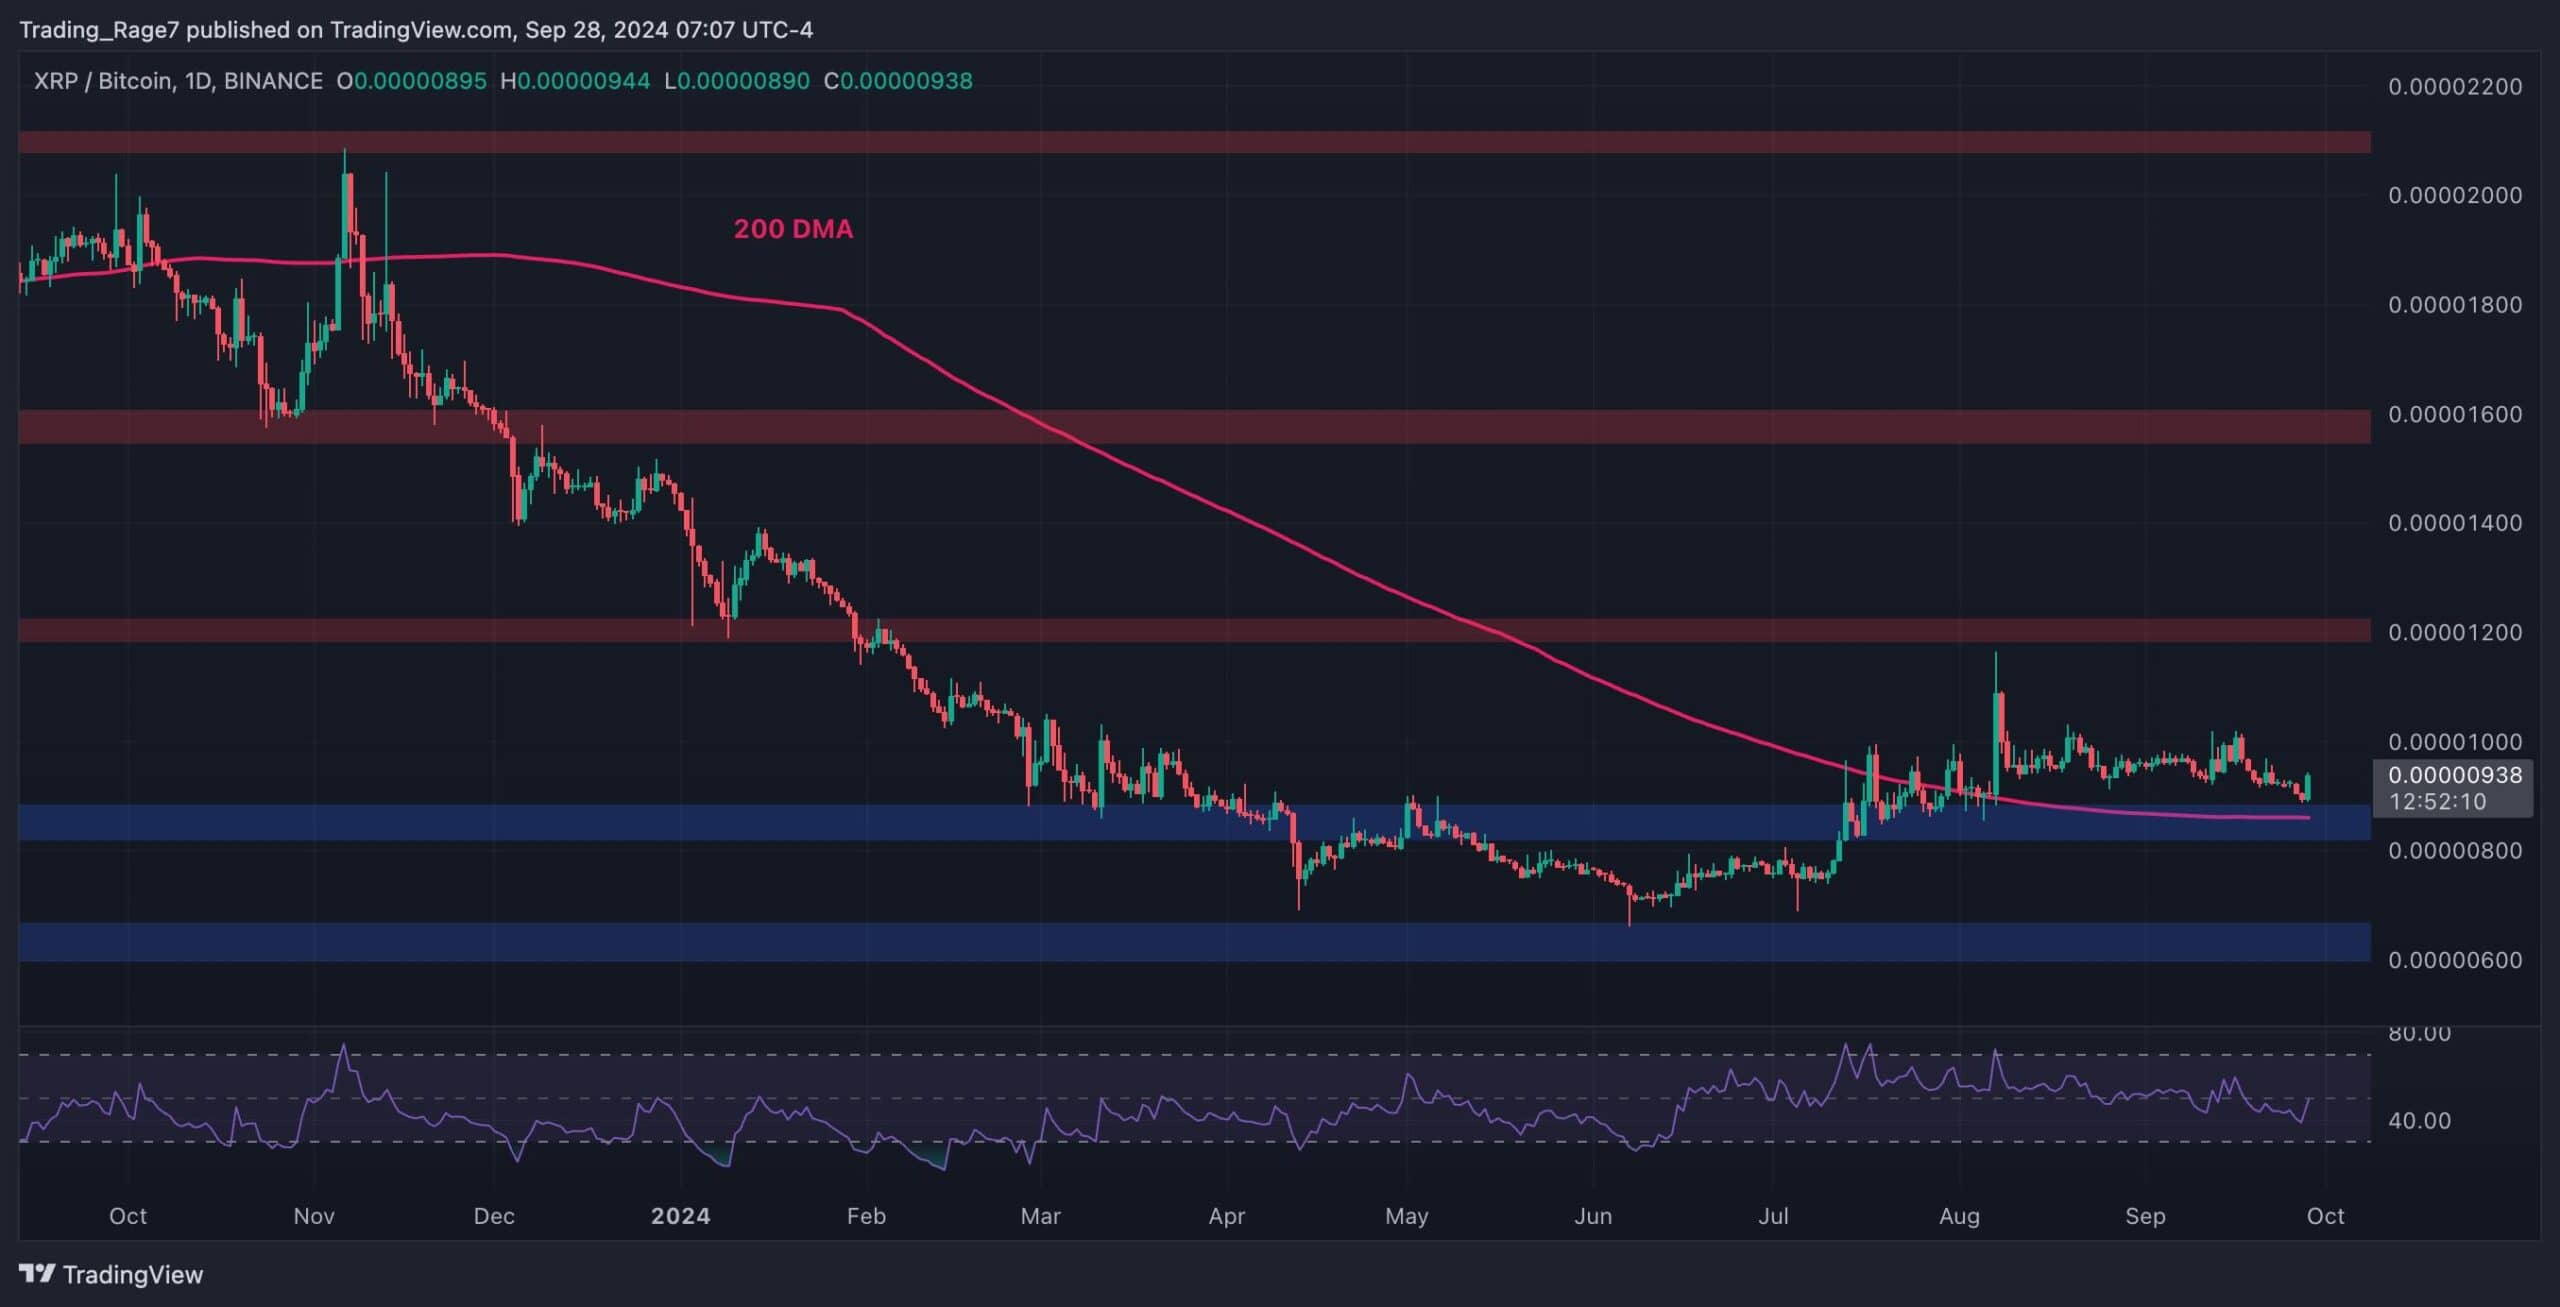
The XRP price has been declining since its rejection from the 1,200 SAT area and has been approaching the 200-day moving average, which coincides with the 800 SAT support zone.
Yet, the market is demonstrating a rebound from the 800 SAT level, and the RSI is also on the verge of rising above 50%. As a result, it is likely that the market will rise above the 1,000 SAT mark once again in the short term.

 cryptopotato.com