According to market analyst EGRAG, there is growing confidence in an explosive 888% surge in the price of XRP if it can recapture previous highs.
In his latest analysis, EGRAG pointed to a specific recurring chart pattern observed on XRP’s 1-month chart, identifying similarities with its price movements from 2017.
During that time, XRP repeatedly touched a red ascending support line four times before launching into its historical 2017 bull run. Today, the chart seems to be mirroring that scenario as XRP recently tapped the same ascending support line for the fourth time.
EGRAG argued that the bulls could muster enough strength to push XRP to a $31 price once the market meets certain conditions. Interestingly, this $31 level coincides with a major Fibonacci extension level (Fib 1.618).
The $31 Target: What It Would Take
Notably, EGRAG believes the key to unlocking much larger gains lies in surpassing the $3.31 all-time high XRP attained in the 2017/2018 cycle. Recall that XRP spiked from a low of $0.003 in January 2017 to a peak of $3.31 in January 2018 during the bull run of that time.
EGRAG believes that should XRP retake this $3.31 peak, a modest 20% of the 4,500% rally that followed XRP’s 2017 bull run would be sufficient to send it into another meteoric surge.
This would align the price with the Fib 1.618 levels, with the first major target being $6.50, based on the high achieved in 2021. Beyond that, XRP could climb toward the ultimate target of $31.
XRP Short-Term Outlook
While the long-term outlook looks promising, XRP’s short-term scenario presents mixed sentiments. As of the time of writing, XRP trades at around $0.5889, facing a tough battle to sustain itself above the crucial $0.60 resistance level.
According to data from the daily chart, XRP remains below its short-term Conversion Line of the Ichimoku Cloud at $0.5937, which currently acts as immediate resistance despite the ongoing market recovery.
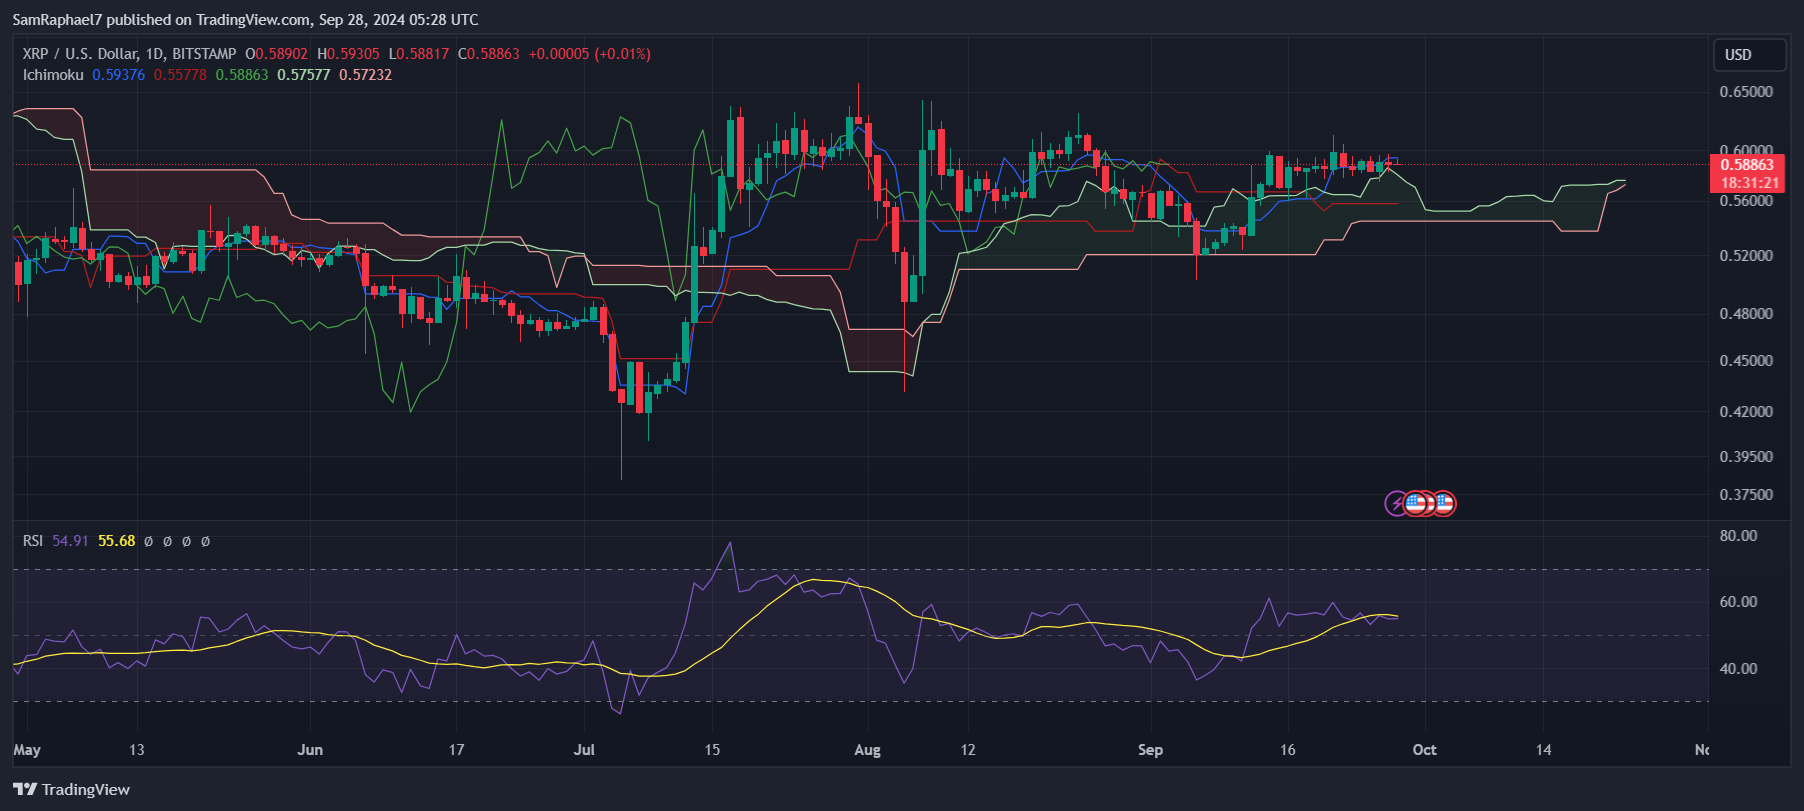
Nonetheless, XRP has found some support around the Base Line ($0.5578) and the Leading Span A ($0.5757), allowing it to maintain a relatively stable position above these key levels.
This indicates that while resistance remains strong, XRP is not facing immediate downside pressure and could continue consolidating around its current levels until it either breaks higher or slips back toward support.
The daily RSI reading of 54.91 indicates that momentum remains neutral to slightly bullish. If XRP can decisively break above $0.60 and hold that level, this may signal the beginning of a new upward trend.