A recent analysis on TradingView argues that Shiba Inu could soon advance to the long-lost $0.00003 price level.
Over the past few months, Shiba Inu has struggled to maintain a consistent positive trend. Its price actions have been characterized by sideways movements with dipping prices. However, last week, Shiba Inu engineered an unexpected comeback, breaking out from the $0.000013 price level and reclaiming the $0.00001501 region.
Meanwhile, the bull run soon lost momentum, with SHIB dipping to $0.00001419 shortly after. At press time, SHIB is trading around $0.00001467, growing by 2% in the last 24 hours, yet the value remains below its monthly highs.
As Shiba Inu’s bull trend gradually gains momentum, a recent analysis has highlighted that SHIB could be gearing up to reverse its months-long downtrend with a significant breakout rally. It pointed out several recent technical indicators confirming this impending development.
Technical Indicators Confirming Shiba Inu Road to $0.00003
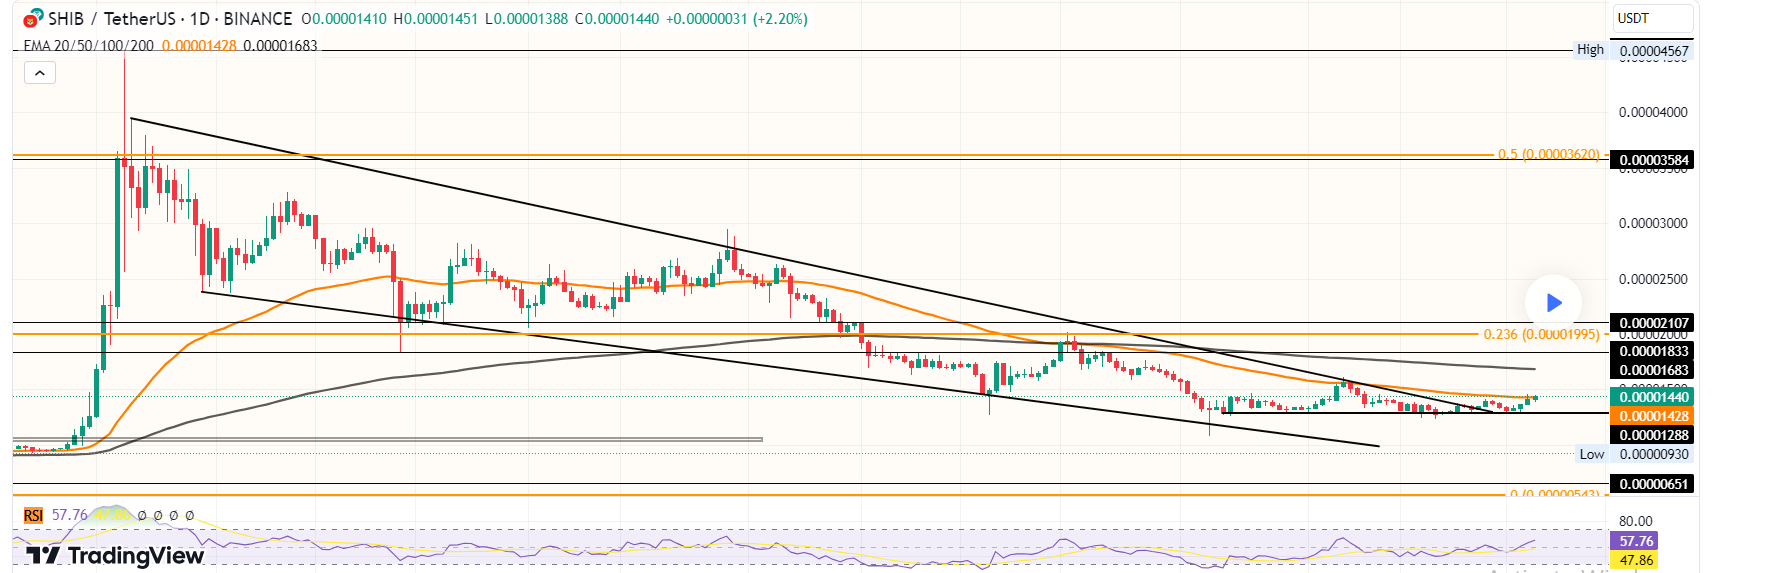
First, the analysis noted that Shiba Inu’s enduring fall of over 67% from its March yearly high has formed a falling wedge pattern, viewed by analysts as a potential signal for a bullish reversal.
Secondly, it noted that Shiba Inu’s recent comeback rally led it to break above its overhead trendline after forming a double-bottom reversal pattern.
Also, on the one-day charts, Shiba Inu has registered four consecutive bullish candles, highlighting renewed buying interest. During this time, SHIB has seen over 10% price gains.
Furthermore, the report noted that the relative strength index (RSI) for SHIB has turned bullish and is nearing overbought territory. This indicates strong buying pressure, adding further momentum to the ongoing rally.
The Paths for Shiba Inu to Rally to $0.00003
According to the analysis, Shiba Inu is currently testing critical resistance at the 50-day exponential moving average (EMA). If the coin manages to break above this level, it could continue its upward trajectory.
The next target would be the 200-day EMA, situated at $0.00001683. Overcoming these resistance levels would strengthen the case for a sustained bullish move.
The next significant psychological resistance is at $0.000020. As a key round number, traders often focus on this level, making it critical for the asset’s price action.
Beyond this psychological barrier, if the coin maintains its bullish momentum, SHIB’s next key resistance would be $0.000028, making the $0.00003 level within reach once broken. From the current price of $0.0000147, this would represent a massive gain of over 104%.
Support Level To Watch
On the downside, the analysis noted that SHIB’s critical support remains at $0.00001297. If the price falls below this point, it could signal a return to bearish sentiment, with further declines possible.