
VeChain faces prolonged bearish pressure, but analysts see a potential reversal to the upside.
VeChain ($VET) has faced a challenging six-month period, consistently posting red on its monthly charts. $VET dropped to $0.018 in August and, as of September 20, traded at $0.023.
This level is a 91% slump from its all-time high, reflecting the prolonged bearish sentiment surrounding the altcoin. However, recent analysis suggests a potential turning point could be on the horizon.
Possible Bullish Vechain Move
An analysis from EGRAG, a prominent analyst on X, points to a possible game-changing move for VeChain based on Elliott Wave Theory. The analysis focuses on impulsive and corrective wave patterns, which have influenced $VET’s price movements.
According to EGRAG, $VET is positioned to enter an impulsive Wave 3, a key phase within the Elliott Wave structure characterized by five sub-waves. This phase is often followed by a corrective Wave 4 and then a final Wave 5, which could lead to an explosive price surge, commonly referred to as a blow-off top.
#$VET Move A: $1 or Move B: $2!!!!
The next move for #Vechain is going to be a game-changer! 🎯
If we're entering impulsive Wave 3️⃣, it needs to show 5 sub-waves. If this next impulsive structure hits all the right criteria, get ready for a quick and aggressive corrective Wave… pic.twitter.com/Di01tmg0sP
— EGRAG CRYPTO (@egragcrypto) September 21, 2024
The analysis suggests that the expected price movements could occur rapidly, with historical data indicating similar waves completing within approximately 150 days. Potential targets include $0.91 if $VET follows what EGRAG calls Move A, and a more ambitious $2.26 if it trails Move B.
Indicators Signal Mixed Momentum
Meanwhile, indicators from TradingView provide additional insights into $VET’s current market conditions. The Bollinger Bands reveal that $VET has been trading near its lower band, indicating sustained bearish pressure with minimal bullish attempts.
A slight narrowing of the bands hints at reduced volatility, suggesting a consolidation phase that might precede a significant price move once volatility picks up.
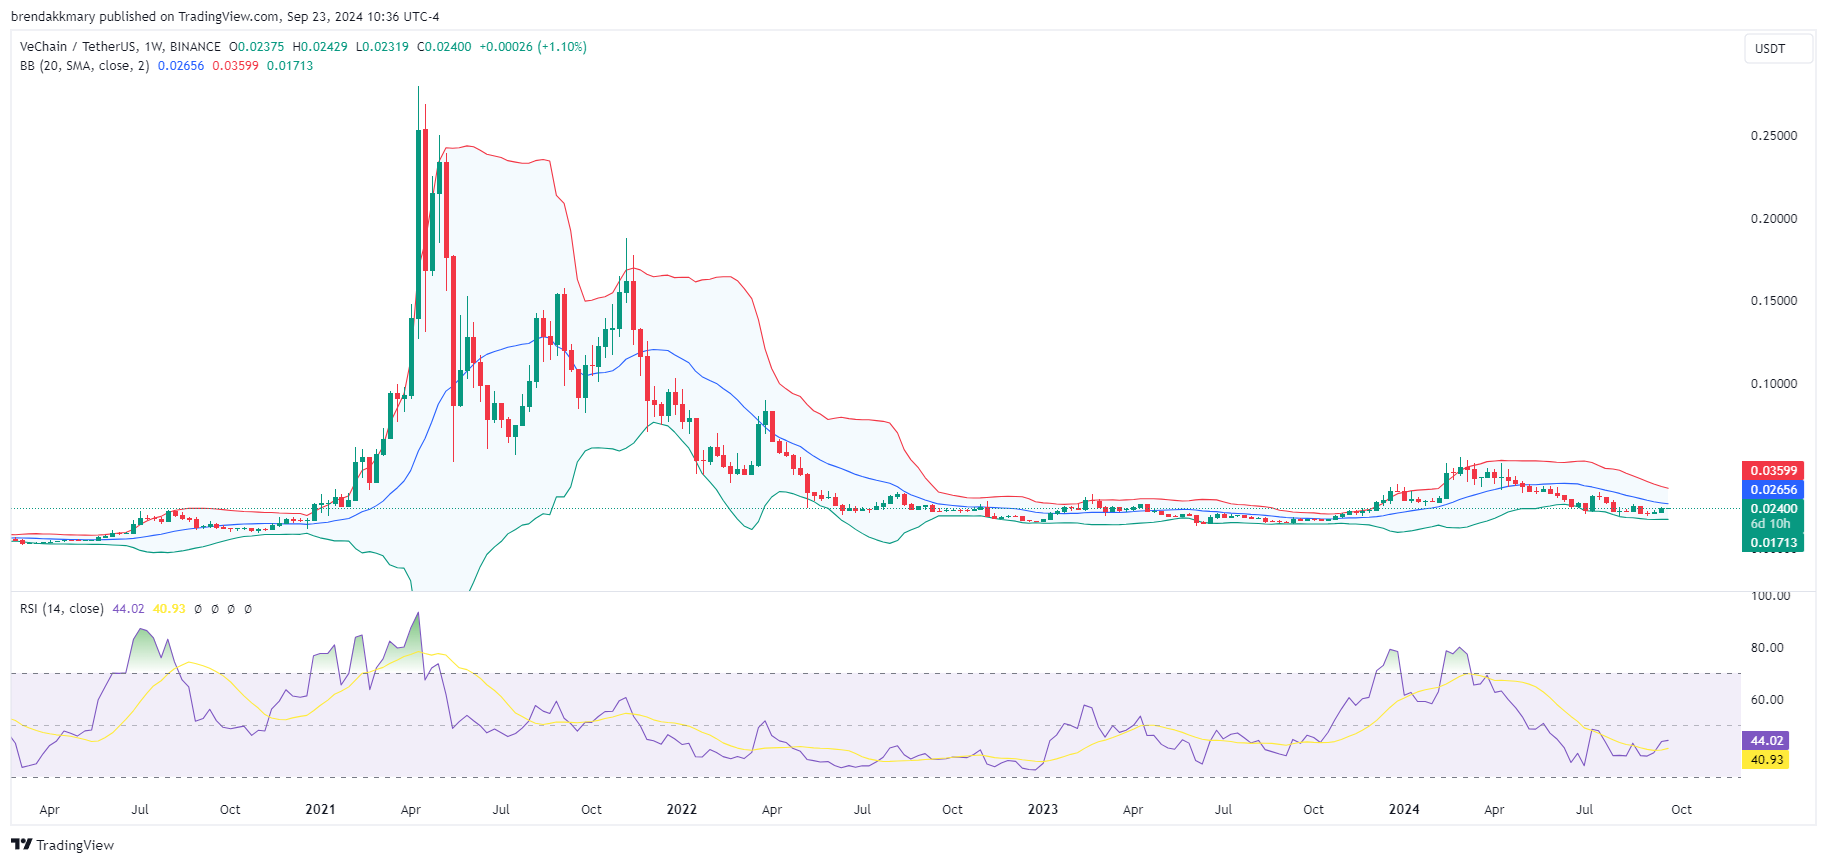
The Relative Strength Index (RSI), currently reading around 43.53, shows weak bullish momentum. Having recently crossed above the 40-level, the RSI indicates a transition from bearish to neutral sentiment, which could signal an emerging shift in the market.