The bulls are now gaining back control in today’s session, as seen from the increase in the global market cap. The total cap stood at $2.15T as of press time, representing a 3.4% increase over the last 24 hours, while the trading volume also jumped by 24.02% over the same period to stand at $95.44B as of press time.
Bitcoin Price Review
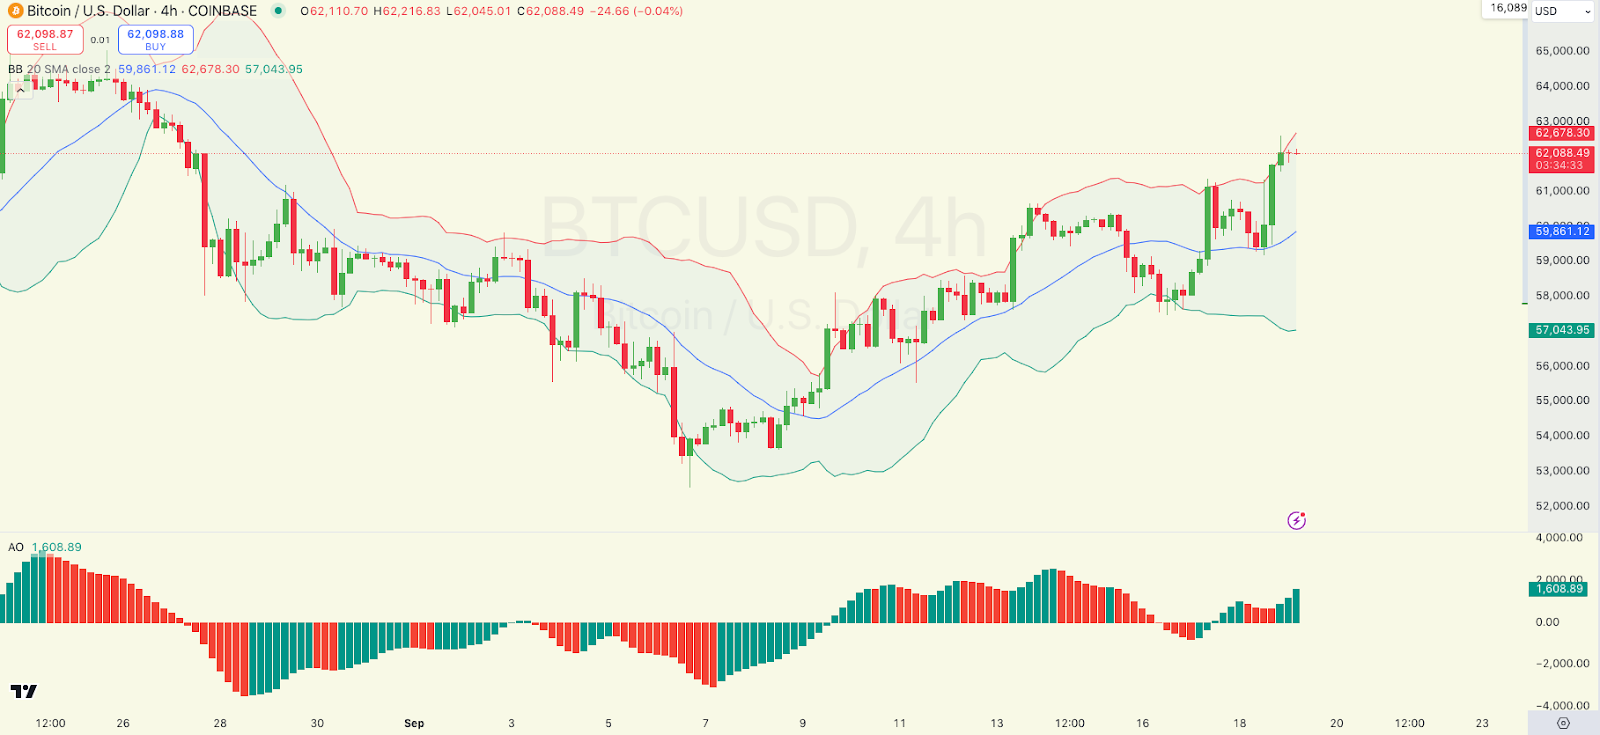
Bitcoin, $BTC, has posted gains in today’s session, as seen from its price movements. Looking at an in-depth analysis, Bitcoin is trading above the middle Bollinger Band, indicating a bullish momentum as the price approaches the upper band. The Awesome Oscillator shows increasing green bars, suggesting growing bullish momentum.
On the other hand, we see that a breakout above the upper band could indicate further upside potential, while failure to sustain above could lead to a pullback towards the middle band around $59,861.12. Bitcoin traded at $62,023.9 as of press time, representing a 3% increase over the last 24 hours.
Ethereum Price Review
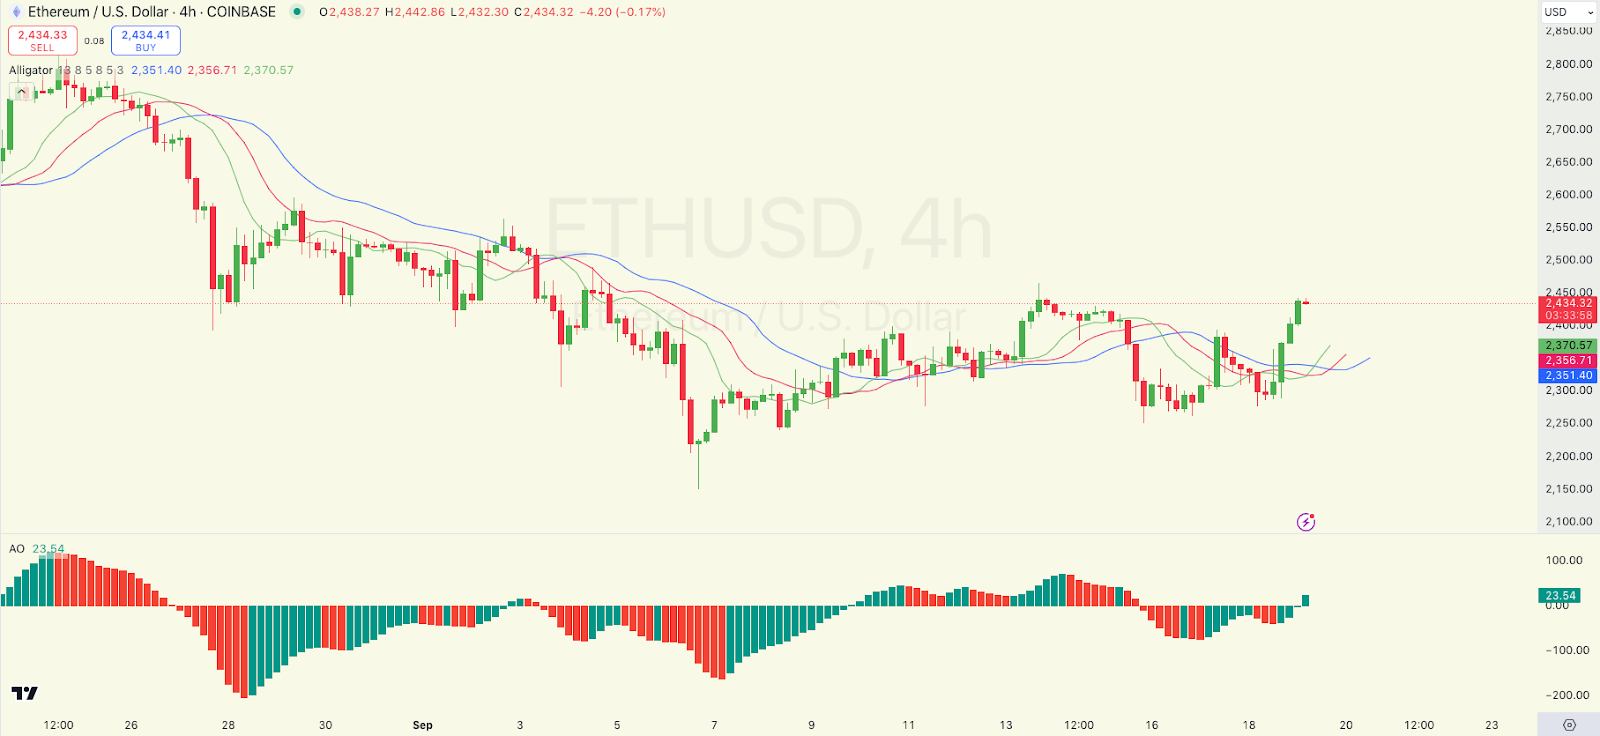
Ethereum, $ETH, is also among the gainers in today’s session as also seen from its price movements. Looking at an in-depth analysis, we see that Ethereum is showing bullish signals with the Alligator indicator’s lines spreading apart, confirming a potential upward trend.
On the other hand, we see that the Awesome Oscillator is showing positive momentum with rising green bars. If Ethereum continues to maintain this bullish structure, further gains can be anticipated, but caution is advised if the green bars start to weaken, signaling a potential reversal. Ethereum traded at $2,434 as of press time, representing a 4.91% increase over the last 24 hours.
Popcat Price Review
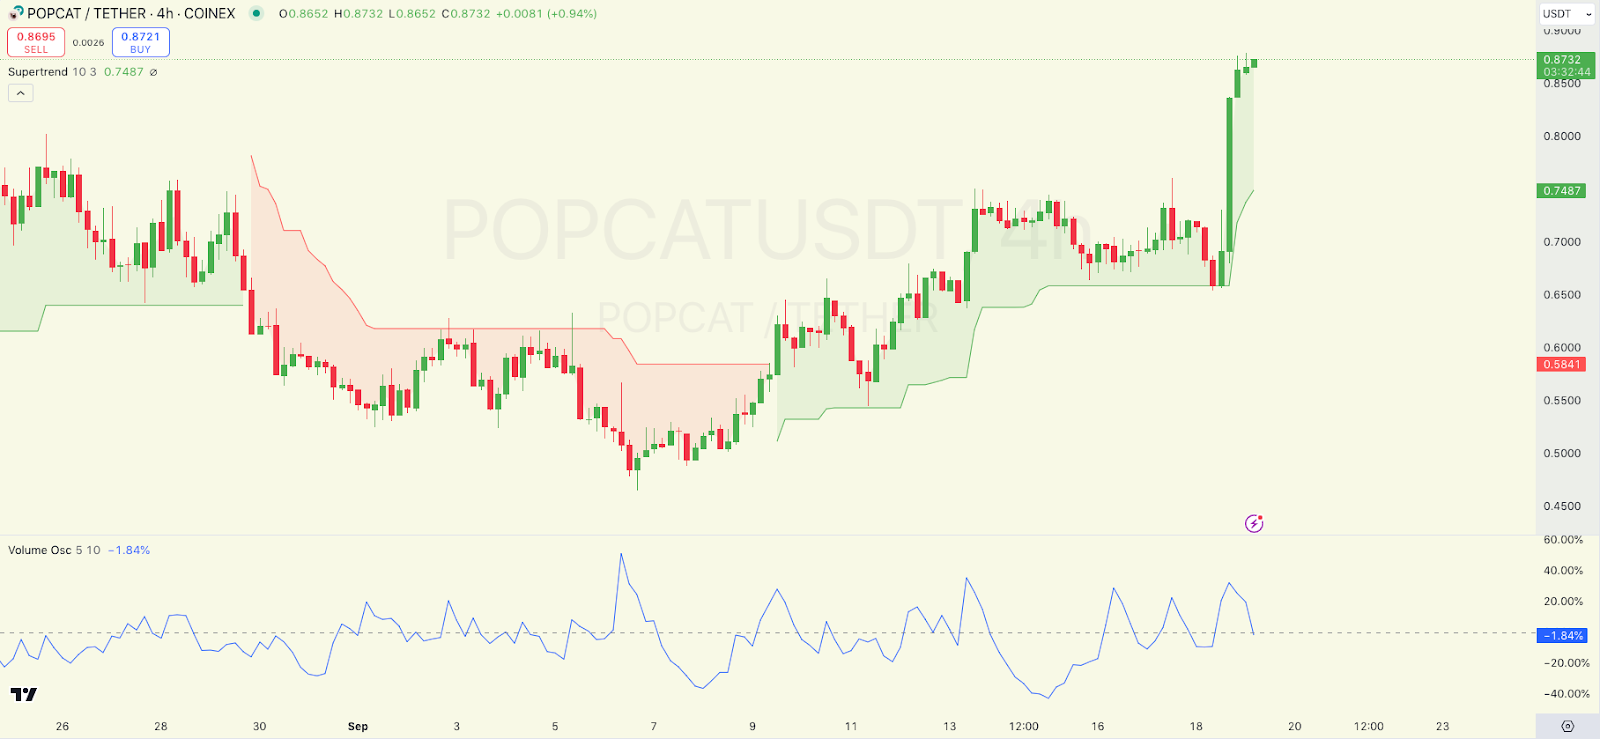
Popcat, $POPCAT, is also among the gainers in today’s session as also seen from its price movements. Looking at an in-depth analysis, POPCAT is trading above the Supertrend line, indicating a strong buy signal. The Volume Oscillator is showing fluctuating volumes with a recent uptick, supporting the current upward movement.
Continuation above the Supertrend can maintain the bullish trend, while a drop below could signal a shift to bearish sentiment. Popcat traded at $0.8691 as of press time, representing a 23.32% increase over the last 24 hours.
Sei Price Review
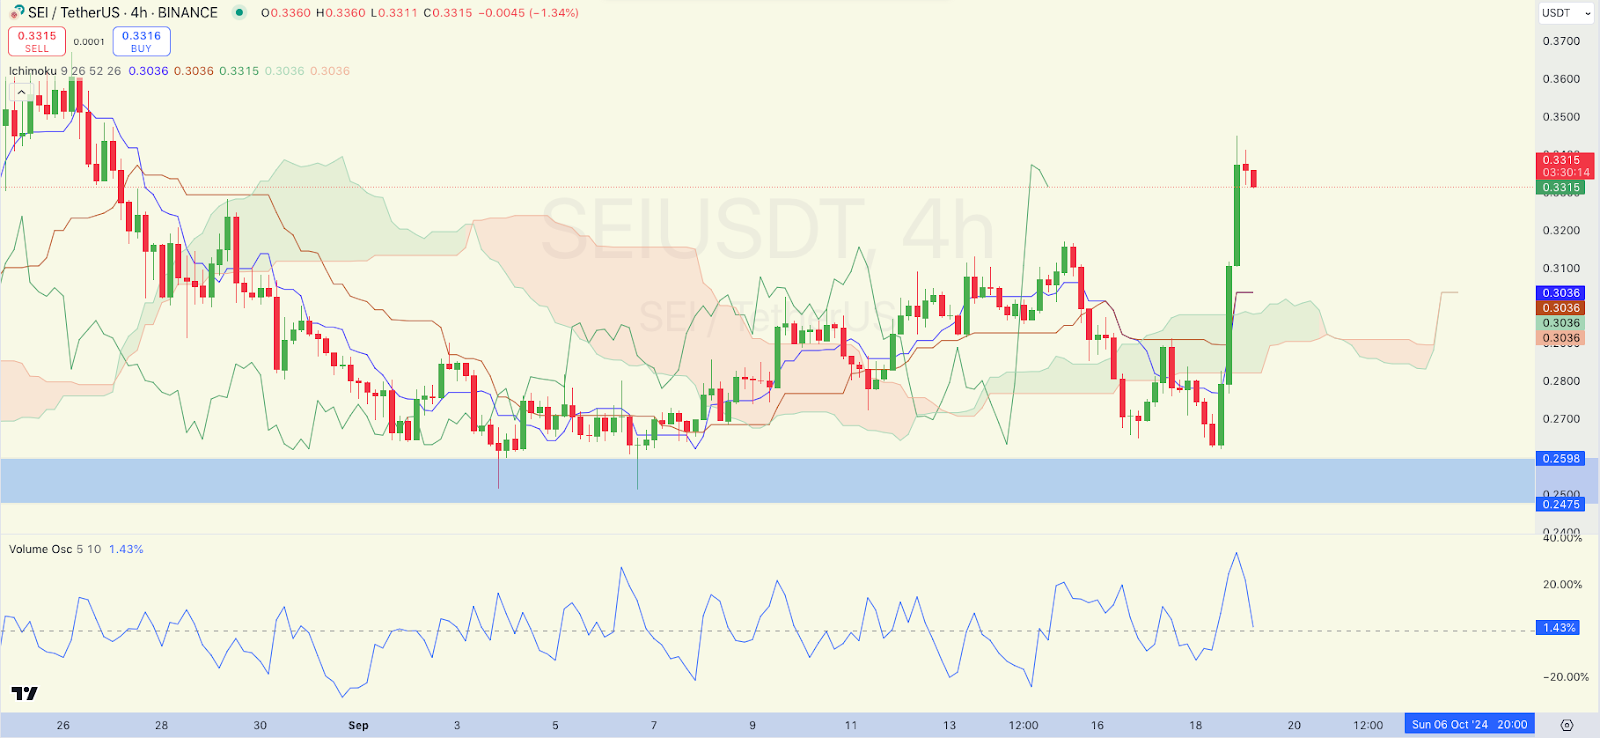
Sei, $SEI, is also among the top gainers in today’s session as also seen from its price movements. Looking at an in-depth analysis, SEI is currently trading above the Ichimoku cloud, which is a bullish sign. The recent breakout from the cloud zone suggests a continuation of the upward movement.
However, the Volume Oscillator indicates moderate buying interest, and a sustained volume increase is necessary to confirm the strength of the trend. A return below the cloud would invalidate the bullish outlook. Sei traded at $0.3278 as of press time, representing a 20.17% increase over the last 24 hours.
Celestia Price Review
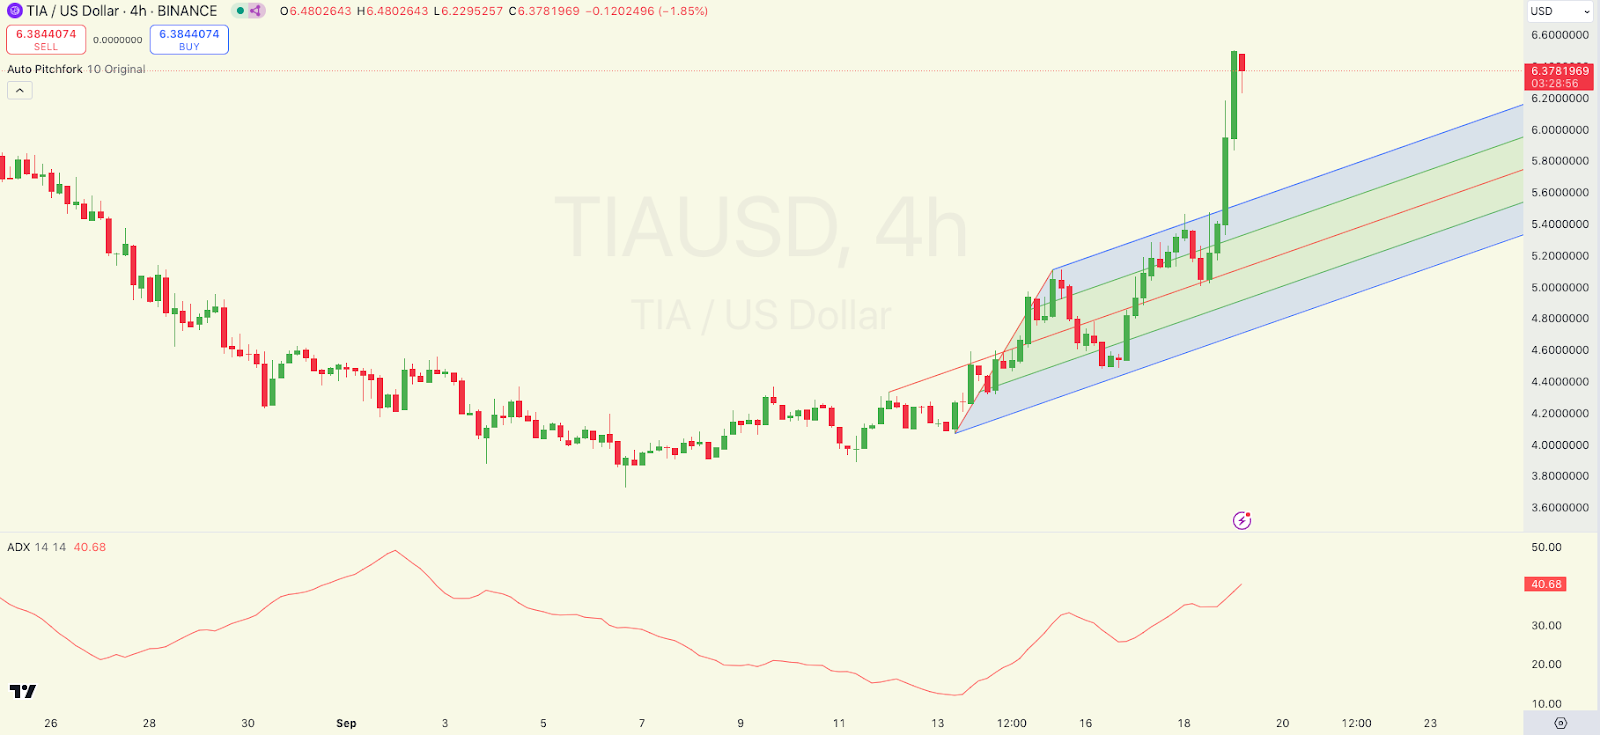
Celestia, $TIA, has also emerged among the top gainers in today’s session as also seen from its price movements today. Looking at an in-depth analysis, we see that TIA is moving within the bounds of an upward pitchfork channel, indicating an ongoing bullish trend. The ADX value is above 40, which shows strong trend strength. The price is currently testing the upper boundary of the pitchfork.
A successful break above could lead to further gains, while resistance at this level could result in a correction towards the midline of the pitchfork channel. Celstia traded at $6.33 as of press time, representing a 20.57% increase over the last 24 hours.
