
$ATOM price has been trading in a downward trend and has replicated a bearish momentum since mid-June. It was corrected by over 50% in the last three months and hovered close to the 52-week lower trajectory of $3.50.
Watch out for the the $5 mark, this level could indicate the next trend reversal. Meanwhile, Bitcoin (BTC) and the general crypto market experienced mild gains and remained positive.
However, $ATOM price struggled to regain positive momentum and continued to bleed gains. Trading below the key EMAs, the bear army had persisted in making short positions, and signs of distribution from the top were noted on the chart.
$ATOM Price Prediction: Is a Recovery on the Horizon?
The daily chart suggests that $ATOM price could create a bullish reversal pattern, which would could trigger a trend reversal. A break and close above the $5 mark would validate the buying strength.
$ATOM price was trading at $4.16 with an intraday rise of over 1.20% at press time. Its market cap has risen to $1.37 Billion and was positioned 47th among the top 100 crypto altcoins.
@Shango83, in his tweet, guided a bearish view that $ATOM crypto price might retest the resistance zone of $5. It could continue its downward rally in the coming sessions.
$ATOM pic.twitter.com/Pv6y5cWETX
— Crypto Shango (@shango83) September 18, 2024
It has been trading close to the confluence of resistance levels at $5. For the past few weeks, steady selling pressure has been observed. $ATOM crypto has faced rejection multiple times amid pullbacks.
As a result, a downward trend is at play, and the bear army continues to showcase its dominance.
Going forward, the trend is bearish, and bounces were not sustained at the highs. Meaning buyers were looking weak, and the battle favored the bear army.
Per the Fib levels, the $4 mark is the prompt 23.6% support zone; slipping below it could send $ATOM price toward its 52-week low region.
Technical Indicators Paint an Optimistic Outlook
Despite the ongoing downtrend, few technical indicators replicate the possibility of a trend reversal. The Chaikin Money Flow (CMF) reading shows a positive outlook. It displays a reading of 0.11, conveying rising capital inflows in the market.
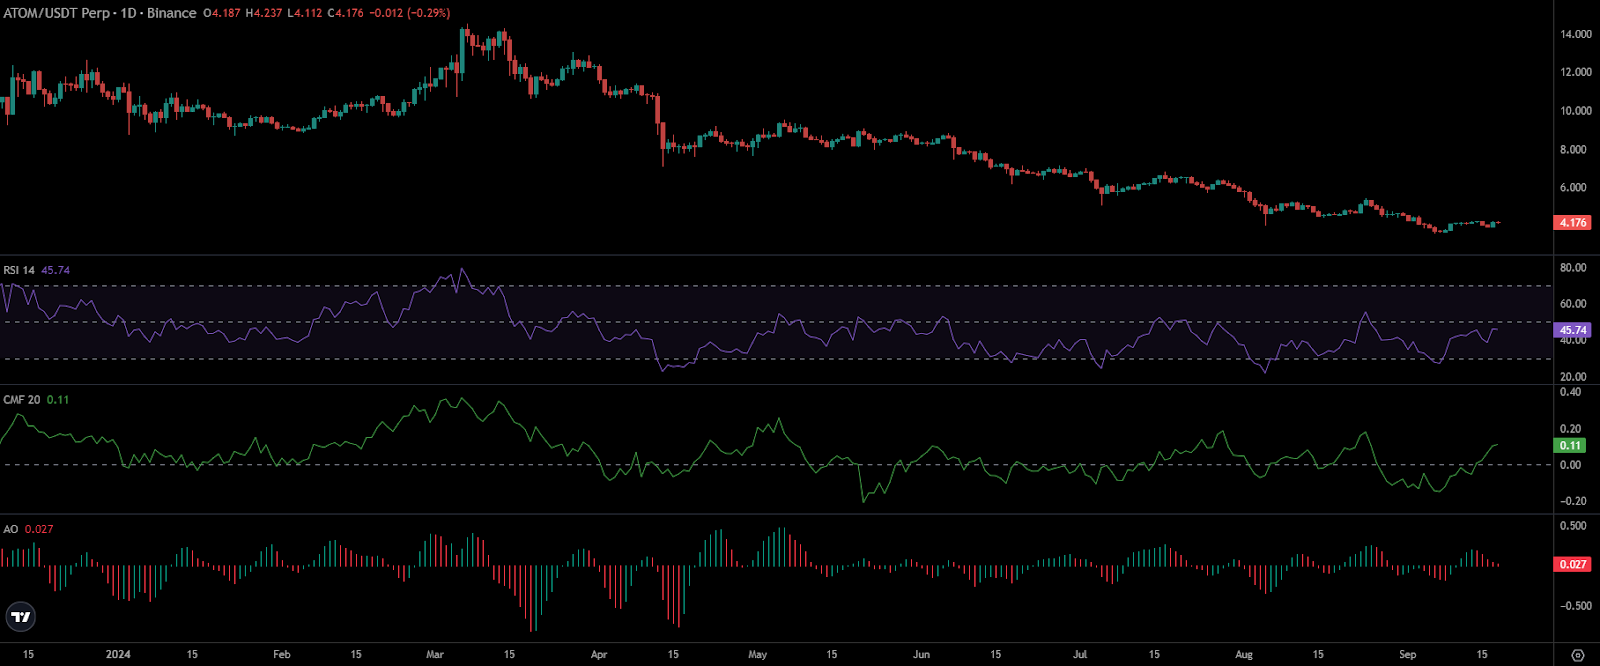
Technical Indicators Data | Source: Coinalyze
This increased liquidity might push $ATOM price beyond the $5 mark. Further, it could trigger a significant potential upward move in the coming sessions.
Also, the Awesome Oscillator (AO) value crossed the zero line, noting around 0.027. This implies that bulls have taken control over bears.
$ATOM’s Futures Market Data Overview
Looking at the futures market data, the OI-weighted funding rate stayed positive, around 0.0087%. It hints at the bullish sentiment among investors.
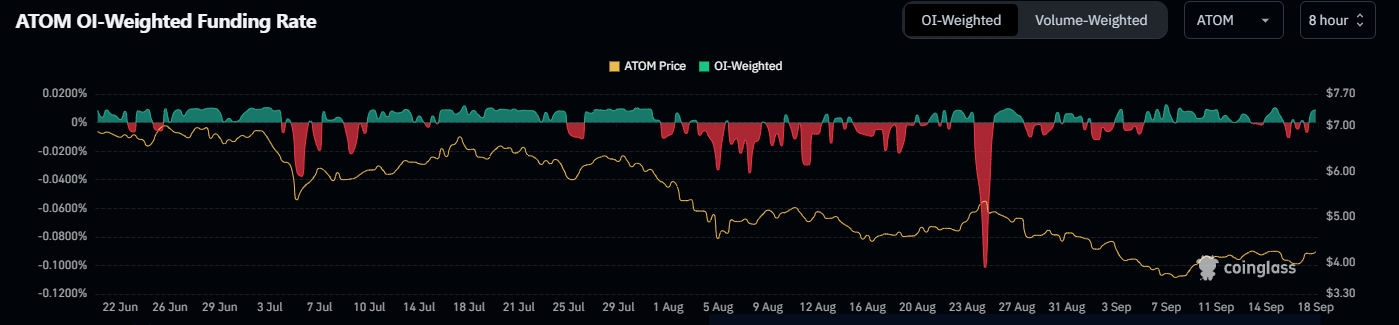
Futures Market Data | Source: Coinglass
Moreover, the Open Interest (OI) soared over 3.10% to $88.65 Million at press time, representing the long buildup activity over the past 24 hours.
The immediate support zones were $4 and $3.80 which acts as a prompt support, whereas the immediate resistance levels were around $4.70 and $5.