Shiba Inu (SHIB) appears to be approaching a critical threshold, raising concerns about a potential steeper decline. In recent months, SHIB has shown significant weakness, largely due to broader market bearishness and other factors.
This analysis explores why, despite a brief relief last week, the meme coin could be headed for another downturn.
Shiba Inu Keeps Struggling
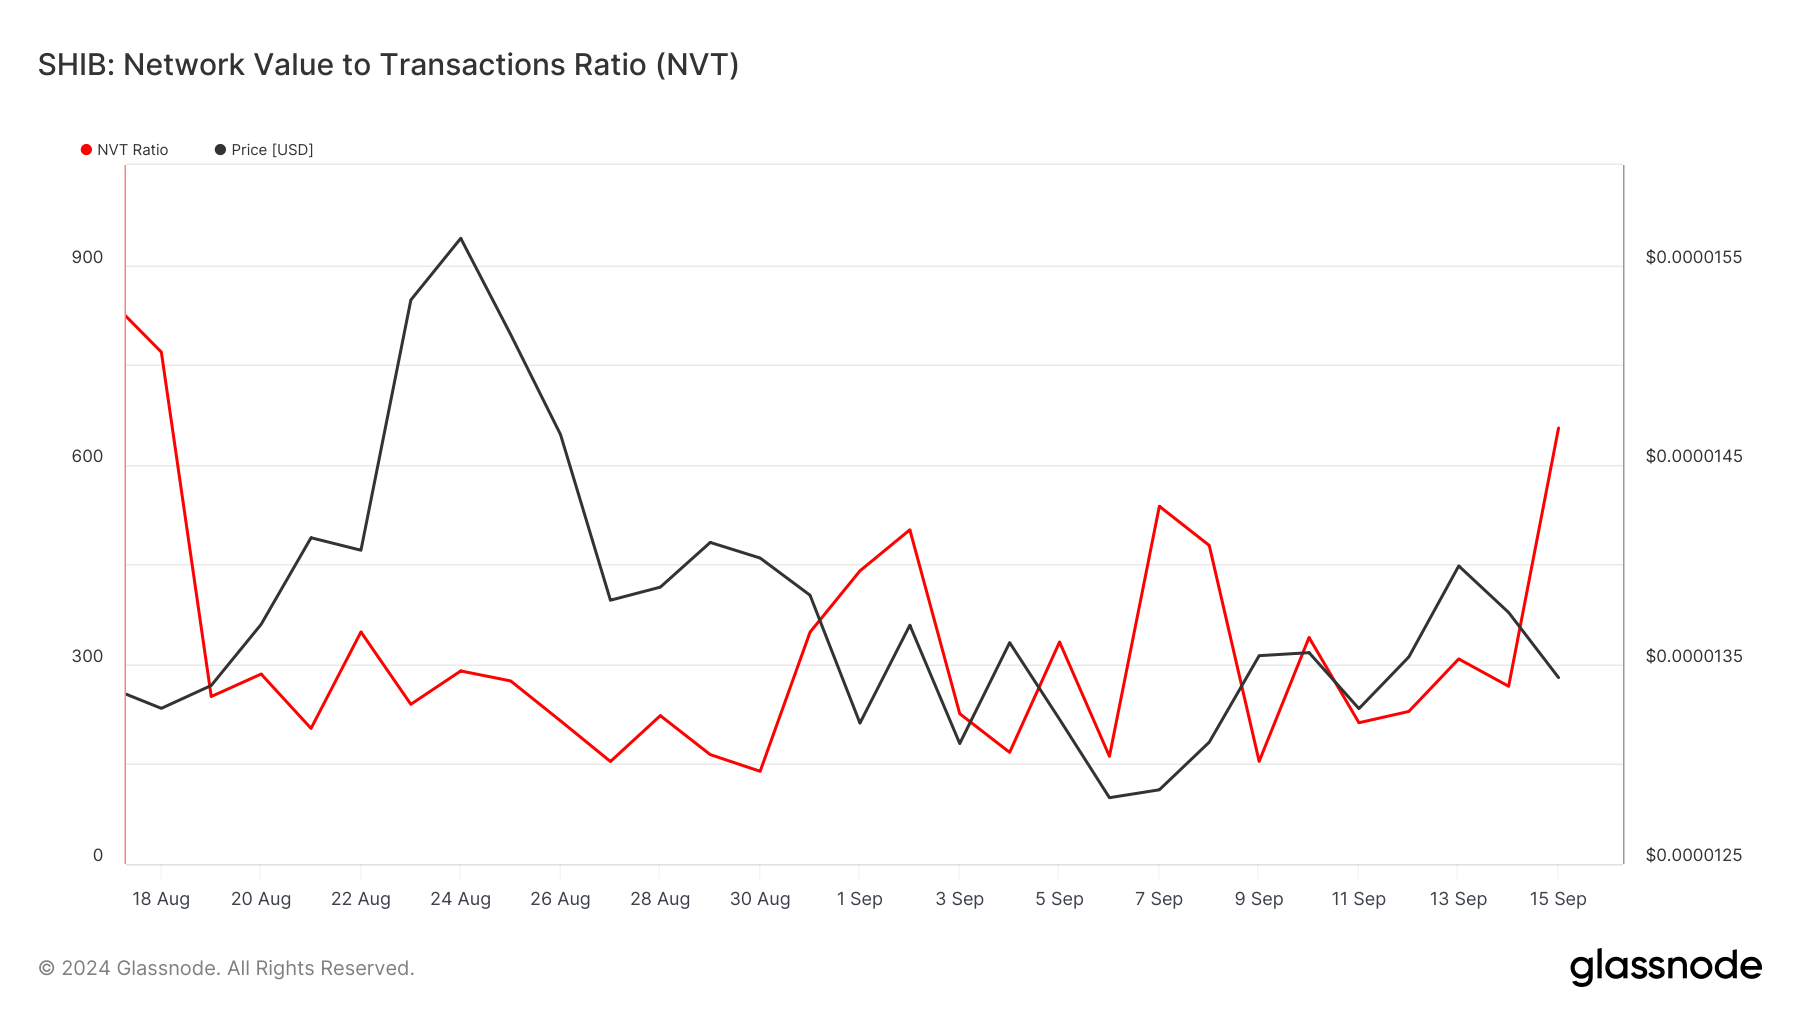
Shiba Inu (SHIB) is currently trading at $0.000013, still down 85% from its all-time high. According to Glassnode, SHIB’s Network Value to Transactions (NVT) ratio spiked on September 14 and remains elevated as of now.
The NVT ratio measures the relationship between the market price (or market cap) and transaction volume. A low NVT ratio typically signals potential price increases, as it suggests high transaction activity relative to market cap growth, indicating that the asset may be undervalued.
In the meme coin’s case, however, the high NVT ratio suggests the opposite. SHIB’s price appears to be at a premium in the short term, implying fewer transactions despite a rising market cap, which could limit near-term price growth.
Read more: 12 Best Shiba Inu (SHIB) Wallets in 2024
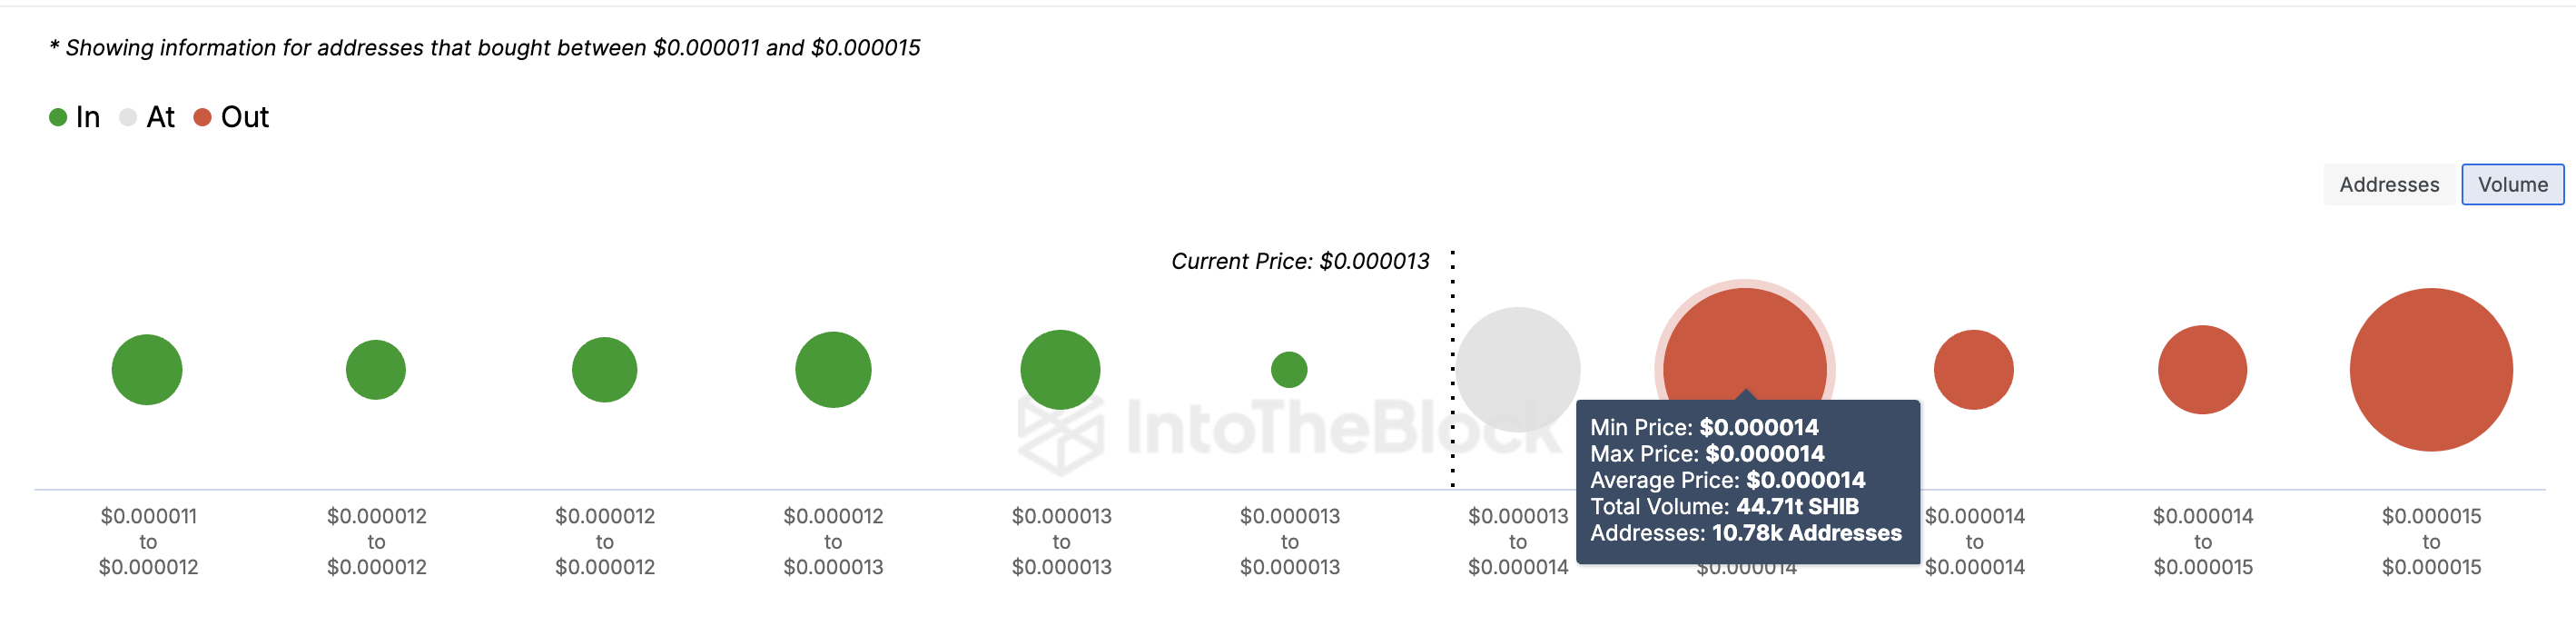
Another indicator suggesting a potential SHIB price decline is the In/Out of Money Around Price (IOMAP), which tracks the price levels where holders accumulate large volumes of cryptocurrency.
The greater the volume at a particular price range, the stronger the support or resistance at that level. According to data from IntoTheBlock, SHIB faces significant resistance at $0.000014, where 10,780 addresses are holding nearly 45 trillion tokens.
This volume surpasses the amount of SHIB held between $0.000011 and $0.000013, suggesting that the supply zone could outweigh demand. If this resistance holds, SHIB’s price could drop to $0.000010.
SHIB Price Prediction: No Respite Ahead
Like the IOMAP metric, the daily SHIB/USD chart also shows resistance at $0.000014. Additionally, SHIB has been trading within a descending triangle pattern since June.
A descending triangle, formed by a downward-sloping upper trendline and horizontal support, is typically a bearish signal that suggests sellers are in control, with prices likely to decline. However, if the price breaks out of the triangle, the bearish outlook could be invalidated.
Read more: Shiba Inu (SHIB) Price Prediction 2024/2025/2030
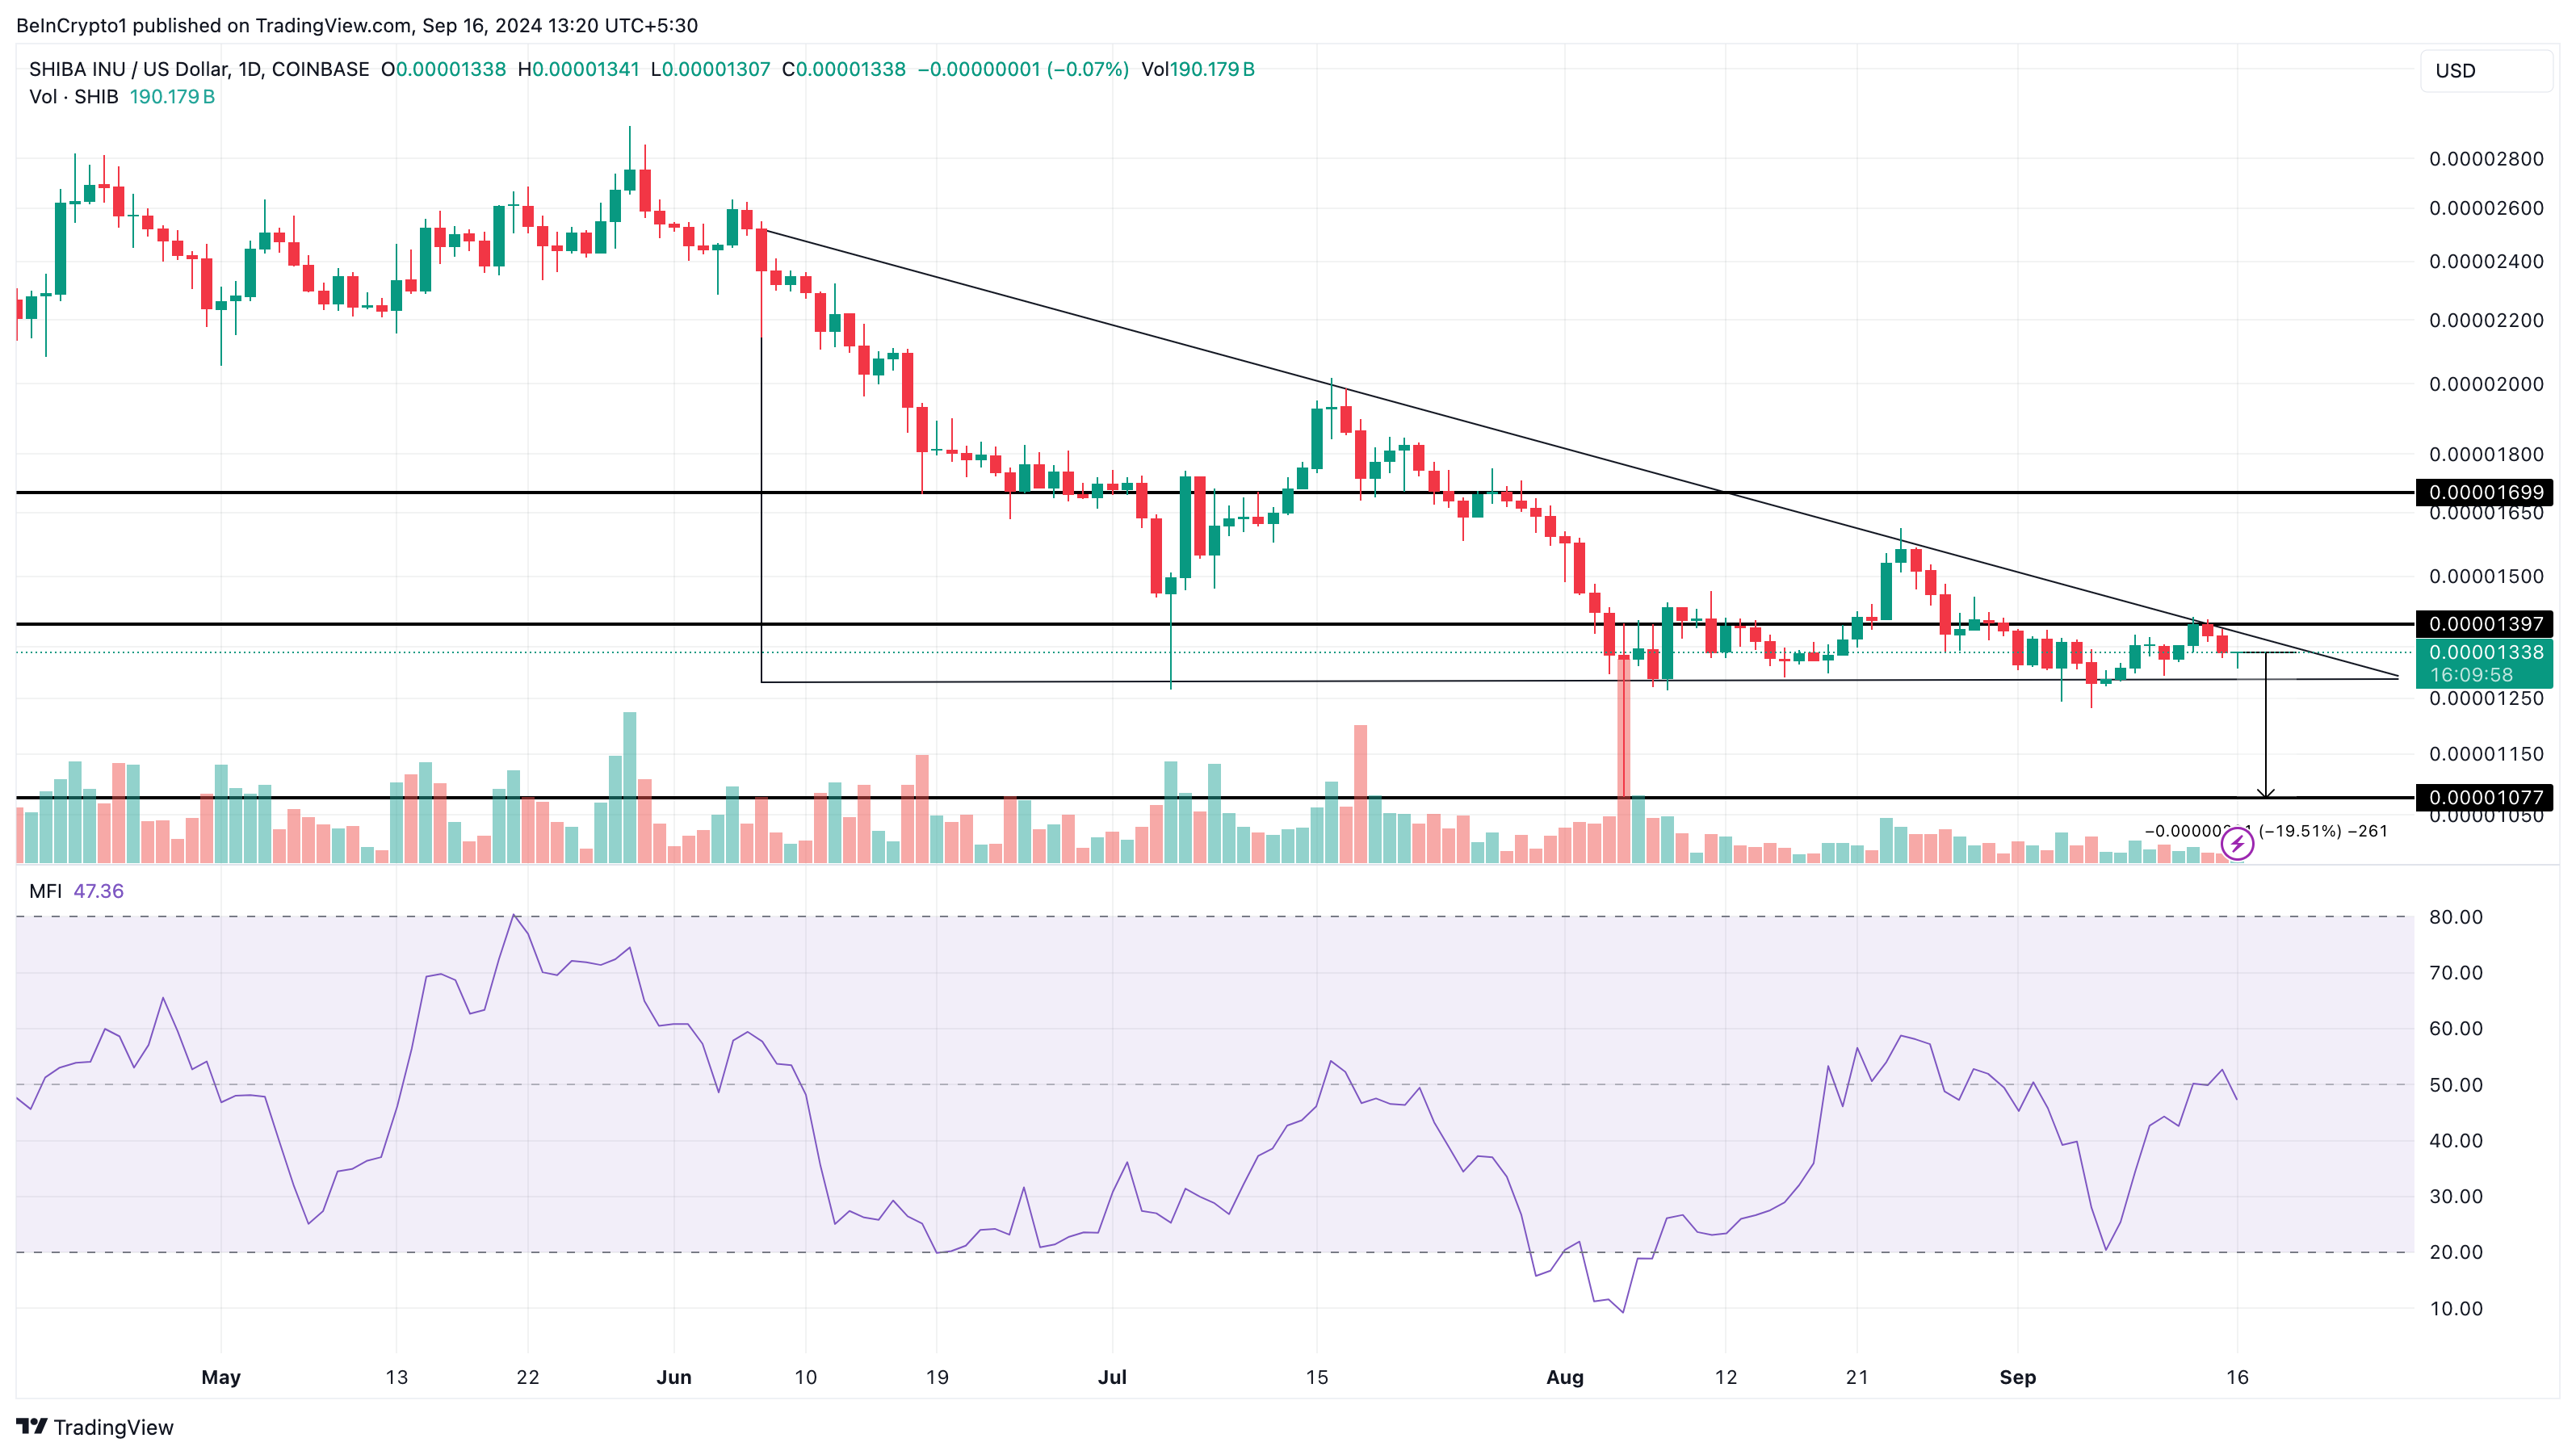
Exceptions, however, occur if the price breaks out of the triangle. In this instance, the bearish thesis might be invalidated. For SHIB, its failure to remain range-bound within the pattern puts its price at risk of a 20% correction that could drag it down to $0.000010.
However, if SHIB breaks out of the triangle, it could invalidate the bearish case and push the price up toward $0.000016.