The overall sentiment for Cardano (ADA) remains bearish, with analysts predicting potential price surges in the future, though not immediately.
Currently, ADA trades within a correction phase, and market participants are now focusing on key levels that could determine its short-term direction. Multiple analysts have examined the technical outlook for Cardano, presenting different outlooks based on its past performance and present indicators.
ATH in December
A chart from market watcher MafeoFerrari highlights an imminent rounded bottom pattern, indicating a potential accumulation phase after this downtrend. The analyst stresses that the $0.22 support level is crucial for Cardano’s structure.
According to MafeoFerrari, if this level holds, ADA could begin its ascent by 2025, potentially reaching $4.6537 by December 2026.
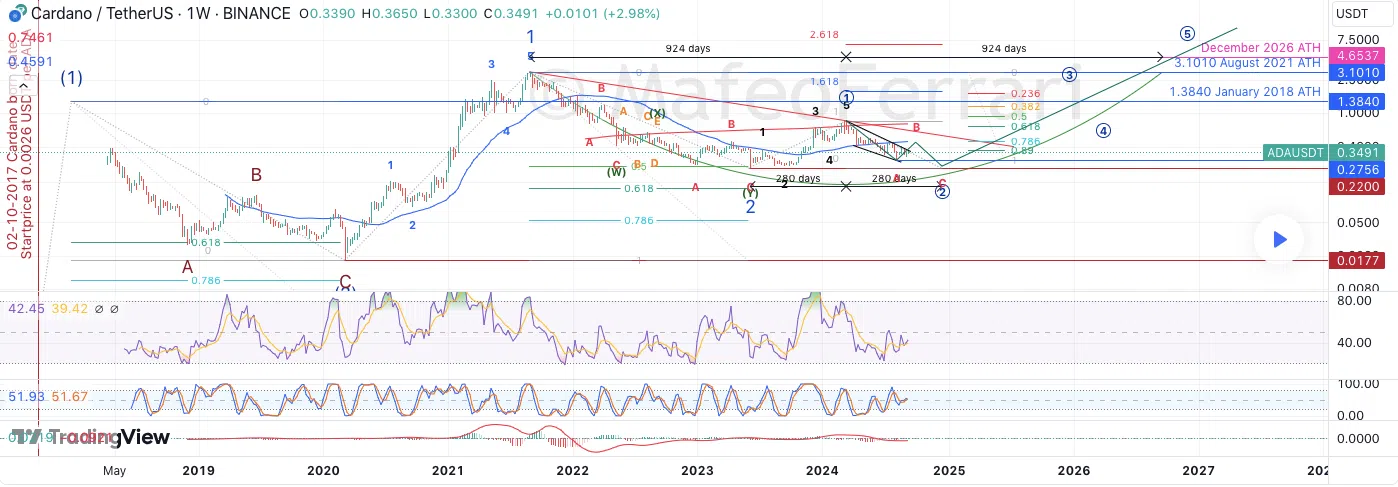
However, the analyst warns that if ADA breaks below $0.22, the price could fall to $0.13, which corresponds to the 61.8% Fibonacci retracement level. This long-term projection remains contingent on market support holding firm, with a clear focus on future upward movement.
Short-Term Resistance and Price Potential
Another analyst, juntech, shares additional short-term data, noting that if the Federal Reserve’s FOMC decides to cut rates by 25 or 50 basis points, ADA might experience a short-term price boost.
Juntech also suggests that, barring any headwinds, Cardano’s price might rise to $0.7098 in the coming months, providing hope for a short-term rebound.
Bearish Technical Indicators
Despite these potential gains, another analyst presents a more cautious analysis. According to this analyst, Cardano remains stuck in a bearish trend, currently trading below the EMA200 line. On the daily chart, ADA failed to break out of a rising wedge pattern and instead encountered strong selling pressure.
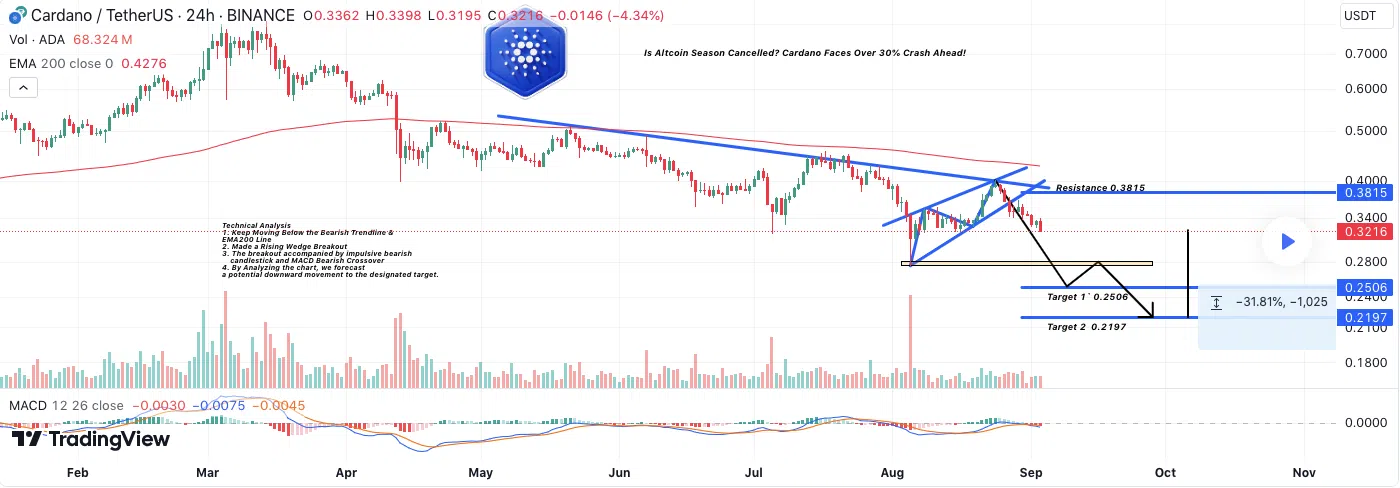
Additionally, the MACD has formed a bearish crossover, signaling further downside risk. As a result, this chartist projects a potential decline toward $0.2506 or even $0.2197, based on Fibonacci ratios of 1.272 and 1.618. However, a break above the resistance level at $0.3815 could offer some hope for a bullish reversal.