The FTT coin price forms a double bottom pattern in the daily chart and the breakout of the pattern can lead to a 30% bull run.
FTT is the native token used by the trading platform for crypto derivatives FTX. The group behind FTX consists of many of the biggest crypto traders in the last few years. Facing issues with the majority of traditional crypto futures exchanges decided to create a platform of their own.
FTX claims it is unique by virtue of its features like clawback prevention, a central collateral pool, and the ability to settle on a universal stablecoin.
Let us move ahead to read about the FTT technical analysis.
Past Performance of FTT
The FTT coin price jumps 10% after finding demand near the horizontal level at $37. Furthermore, the recent rise results in the completion of a double bottom pattern in the daily chart. The neckline of the pattern is at $44 its breakout can result in a rally.
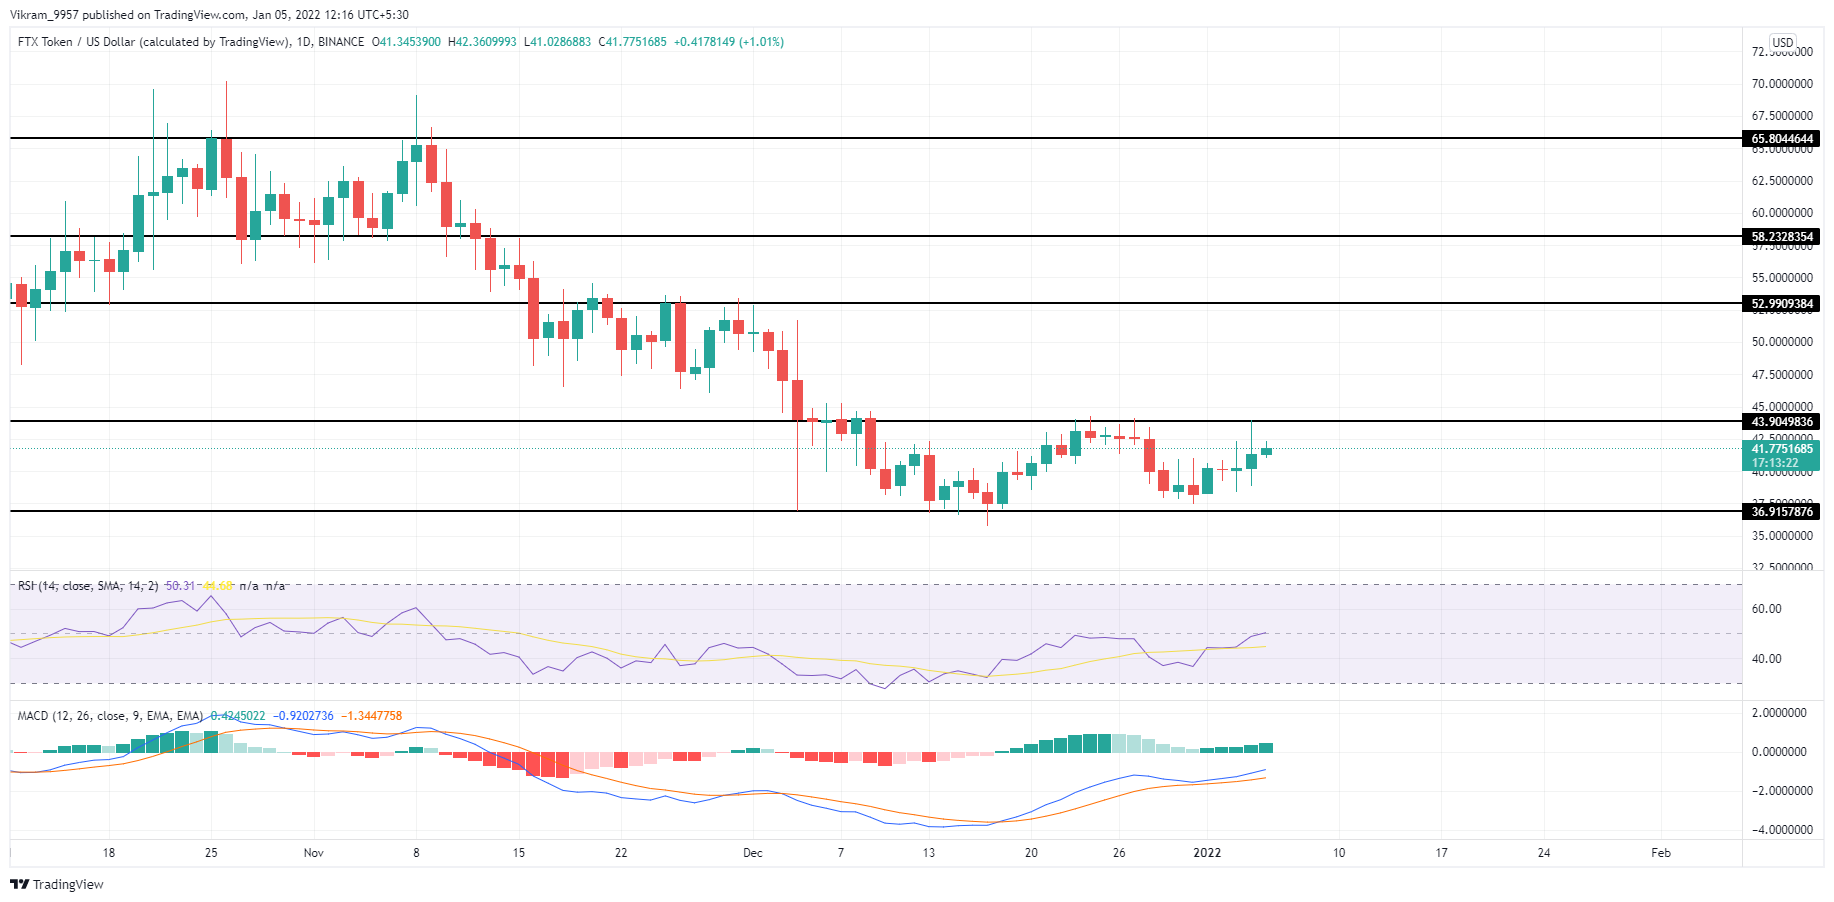
FTT/USD Daily Chart
FTT Technical Analysis
The breakout of $44 will help the FTT coin price initiate a bull run and reach the horizontal level at $58. However, the higher price rejection evident by the long wick formations creates a negative impact on coin price. Therefore, traders need to wait till the price action confirms the breakout.
The RSI indicator at 50% attempts to rise above the central line in the daily chart. Moreover, the slope showcases solid bullish divergence in the last two retracements at $37.
The MACD indicator shows the fast and slow line diverging to increase the gap and avoid the bearish crossover. Moreover, the slopes reflect a bullish divergence just like the RSI.
The breakout of the double bottom pattern can drive the prices higher to the $58 mark if it manages to rise above $52. However, if the price fails to overcome supply at $44, a retracement to $37 is most likely.
Upcoming Trend
The FTT coin price shows a high likelihood of a $44 breakout to drive the prices higher to $58. The technical indicators provide a BUY signal in the daily chart with bullish divergence. However, a confirmation with the price action breakout will provide an extra edge.