Bitcoin and Ethereum have displayed impressive resilience and upward momentum recently. As Bitcoin nears the $60K mark and Ethereum targets $2,400, investors and analysts are closely monitoring these cryptocurrencies’ performance. Both coins have seen notable price movements, which could indicate further growth or potential setbacks.
Bitcoin’s Recent Performance and Key Levels
At press time, Bitcoin (BTC) is trading at $57,917.06 marking a daily increase of 2.48%. This price surge comes after a recent dip, which saw Bitcoin bottom out around $56.5K. The recovery from this low point has been robust, with the current price touching near $57.9K, a key resistance level.
If Bitcoin can break through this resistance, it could pave the way for a push towards the $60K target. Conversely, should the price fall below the support level of $56.5K, it could face challenges in maintaining upward momentum.
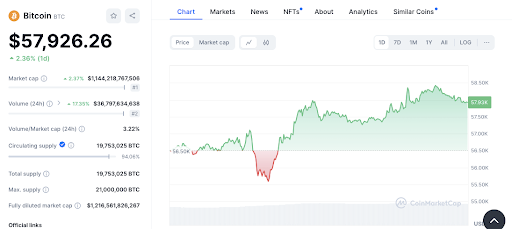
Additionally, Bitcoin’s trading volume has risen by 17.84% over the last 24 hours, suggesting heightened market activity. The market cap has expanded to approximately $1.144 trillion, reflecting a 2.47% increase.
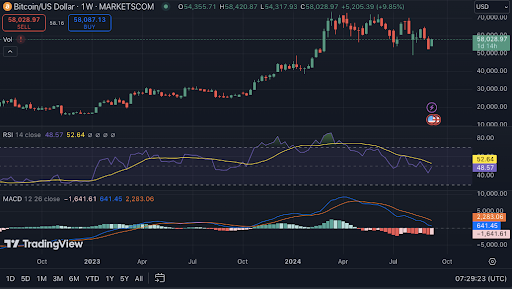
However, the 1-week RSI of 48.48 indicates that Bitcoin is neither overbought nor oversold. The 1-week MACD, currently below the signal line, points to a short-term bearish trend. Therefore, careful monitoring of price behavior around these critical levels is essential for predicting Bitcoin’s next moves.
Ethereum’s Recovery and Future Prospects
Turning to Ethereum (ETH), at publication it is priced at $2,356.29 showing a daily gain of 0.89%. Ethereum has also demonstrated a strong recovery from its recent dip, with a low point near $2,337.
Read also: $1 Billion Bitcoin, Ethereum Options Expiry: Market Impact Analyzed
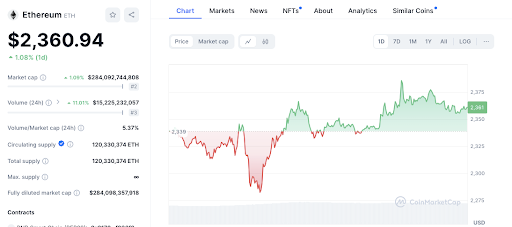
The price has climbed to approximately $2,375, which appears to be acting as a short-term resistance level. A breakthrough above this resistance could signal a continuation of bullish momentum. However, a drop below the support level of $2,337 might lead to a retest of lower support zones.
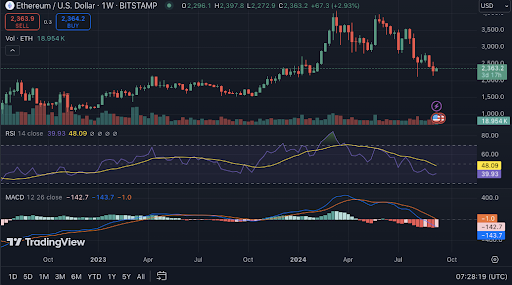
The trading volume for Ethereum has increased by 10.13% over the past 24 hours, reaching $15.2 billion. The market cap now stands at $283.53 billion, up by 0.85%. Ethereum’s 1-week RSI of 39.88 suggests it may be nearing oversold conditions. Like Bitcoin, the 1-week MACD is trading below the signal line, indicating a bearish short-term trend.
Disclaimer: The information presented in this article is for informational and educational purposes only. The article does not constitute financial advice or advice of any kind. Coin Edition is not responsible for any losses incurred as a result of the utilization of content, products, or services mentioned. Readers are advised to exercise caution before taking any action related to the company.