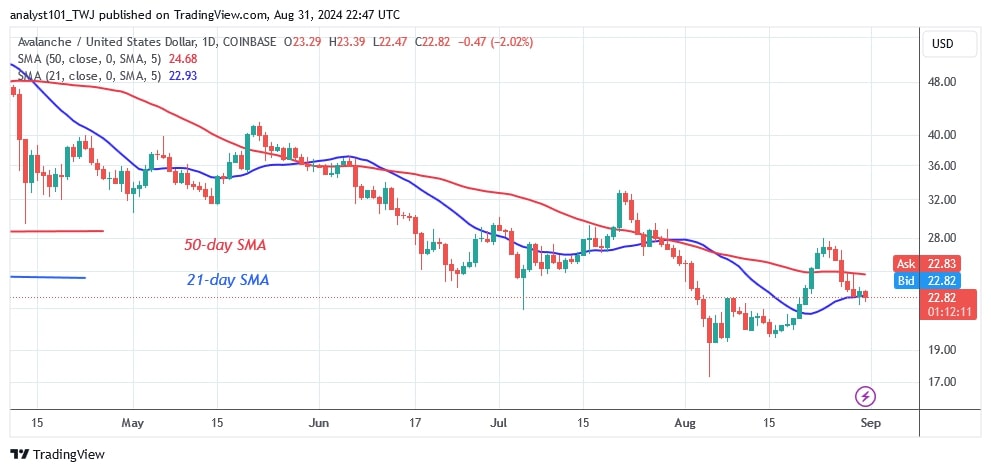
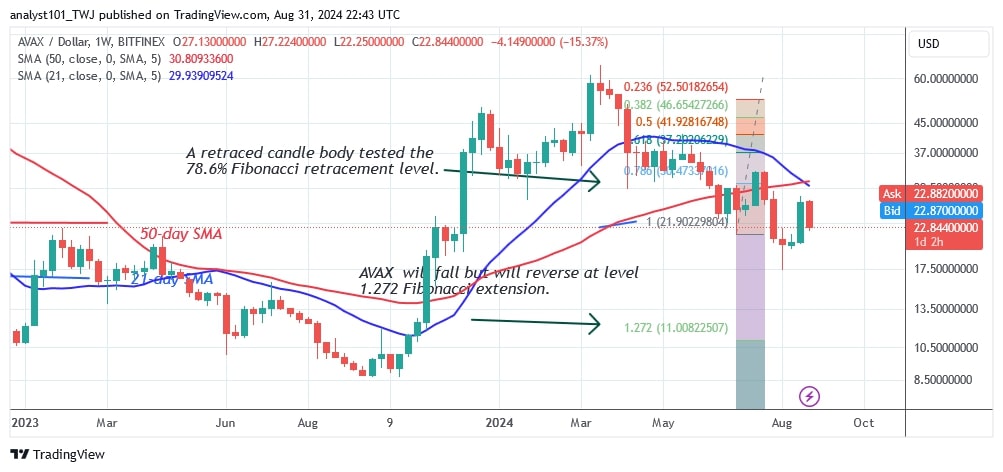
The price of Avalanche ($AVAX) has dropped significantly and is nearing the bottom of the chart. The altcoin has fallen to a low of $17.35 and could fall further.
Long-term analysis of the Avalanche price: bearish
On the daily chart, the upward correction was halted at the $28 high, causing it to fall below the moving average lines. $AVAX has fallen to a low of $22 and is consolidating above its current support.
The 21-day and 50-day moving average lines are hurdles to further upward movement. As long as altcoins remain in the downtrend zone, they are likely to fall. If the altcoin falls below the $22 support, it will reach the projected price of $11.00. In the meantime, the altcoin continues to consolidate above the $20 support.
Analysis of the Avalanche indicator
The moving average lines are trending south, indicating a downturn. After the rejection of the current high, the price bars returned below the moving average lines. The moving average lines cross bearishly and signal a possible decline in $AVAX.
Technical Indicators:
Key Resistance Levels – $60 and $70
Key Support Levels – $30 and $20

What is the next direction for Avalanche?
The cryptocurrency drops below the moving average lines. Selling pressure has dropped to a low of $22. $AVAX is expected to fall if the $22 support level is broken. On the daily chart, the altcoin is trading between $20 and below the moving average lines. The altcoin will fall if the bears break below the $20 support.

Coinidol.com reported last week that $AVAX was falling below the moving average lines after hitting a low of $17.35 before recovering.
Disclaimer. This analysis and forecast are the personal opinions of the author. They are not a recommendation to buy or sell cryptocurrency and should not be viewed as an endorsement by CoinIdol.com. Readers should do their research before investing in funds.
 coinidol.com
