The bears are still in total control in today’s session, as seen from the decrease in the global market cap. The total cap stood at $2.04T as of press time, representing a 3.02% decrease over the last 24 hours, while the trading volume jumped by 6% over the same period to stand at $72.87B as of press time.
Bitcoin Price Review
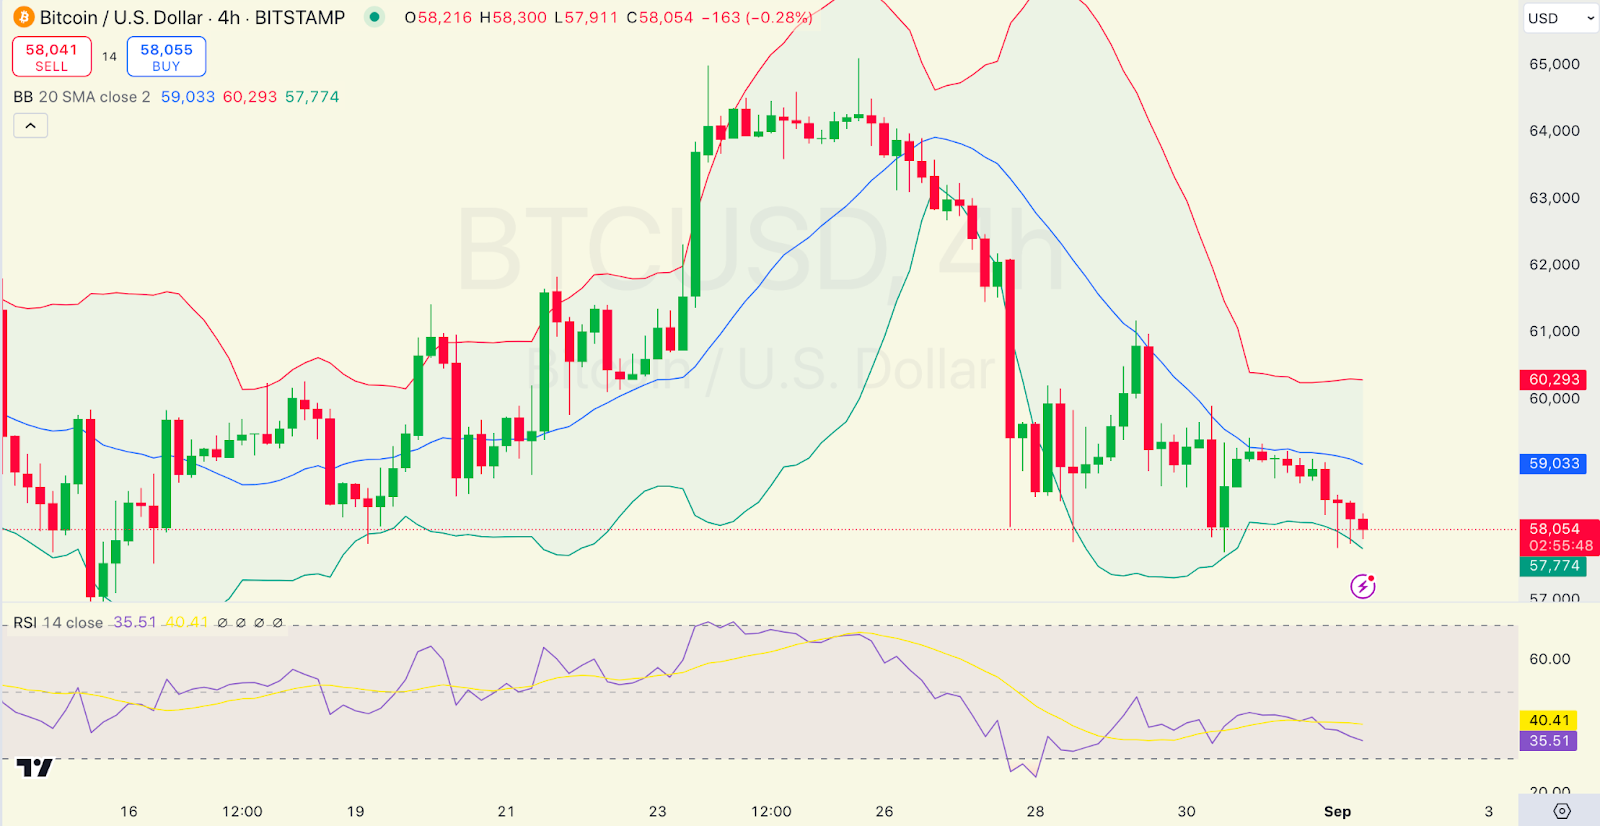
Bitcoin, $BTC, has failed to post gains in today’s session, as seen from its price movements. Looking at an in-depth analysis, we see that Bitcoin’s price is hovering near the lower Bollinger Band, indicating potential oversold conditions. The bands are slightly widening, suggesting increased volatility.
On the other hand, we see that the RSI is at 35.51, which is close to the oversold region (below 30). This suggests that the price might soon experience a reversal or a consolidation phase. Bitcoin traded at $58,006 as of press time, representing a 2.04% decrease over the last 24 hours.
Ethereum Price Review
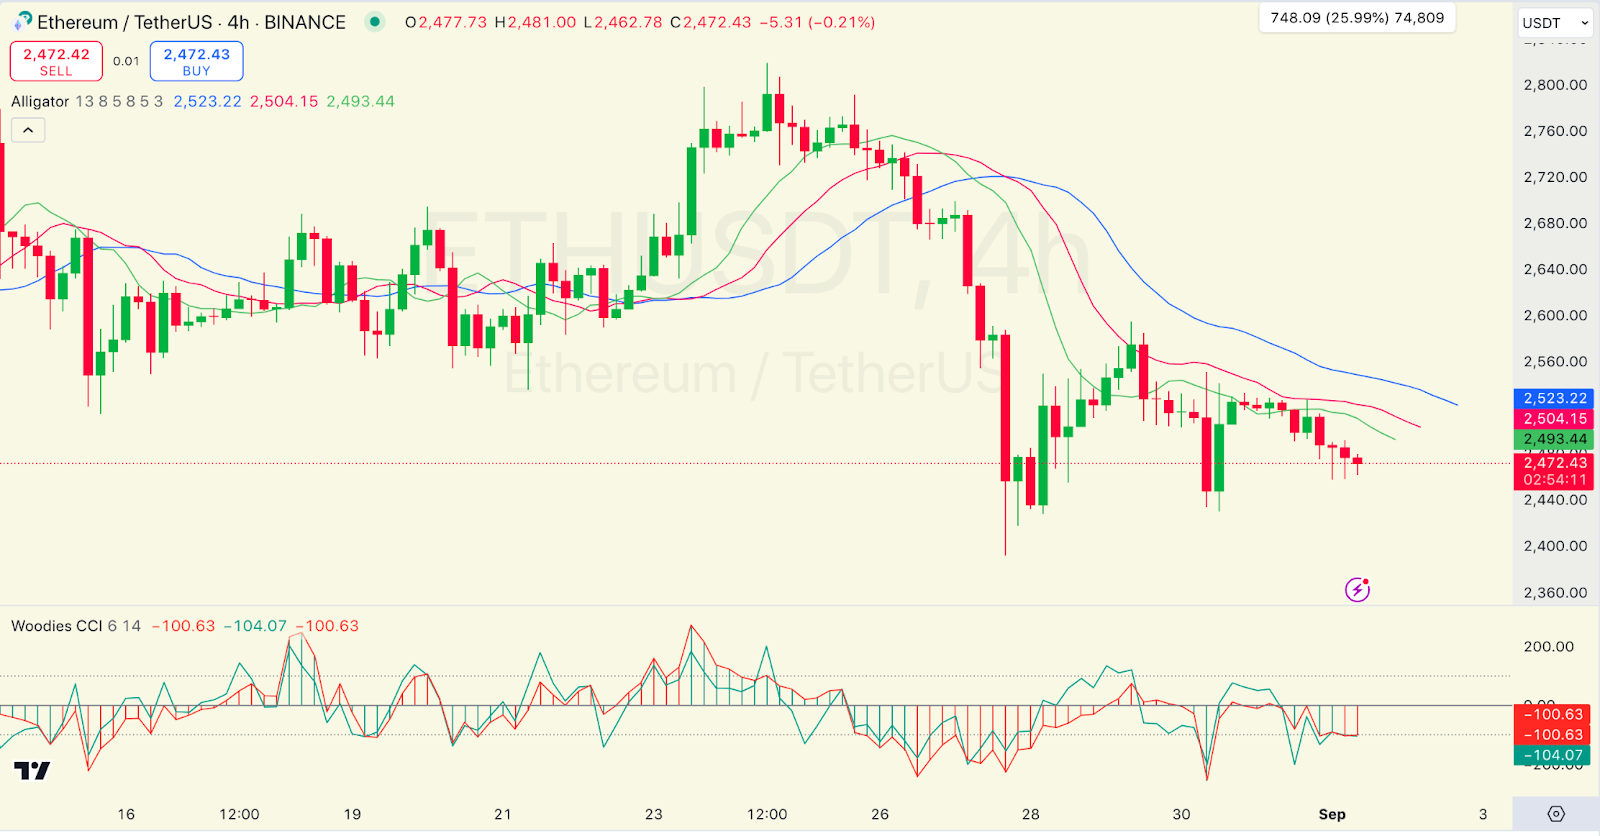
Ethereum, $ETH, has also failed to post gains in today’s session as also seen from its price movements. Looking at an in-depth analysis, we see that the Alligator’s lips (green), teeth (red), and jaw (blue) are showing a downward trend, with the price staying below these lines, indicating a bearish trend.
On the other hand, we see that the Woodies CCI: is around -100.63, which suggests a bearish sentiment. If it stays below -100, it confirms a strong downtrend. Ethereum traded at $2,466 as of press time, representing a 2.36% decrease over the last 24 hours.
Toncoin Price Review
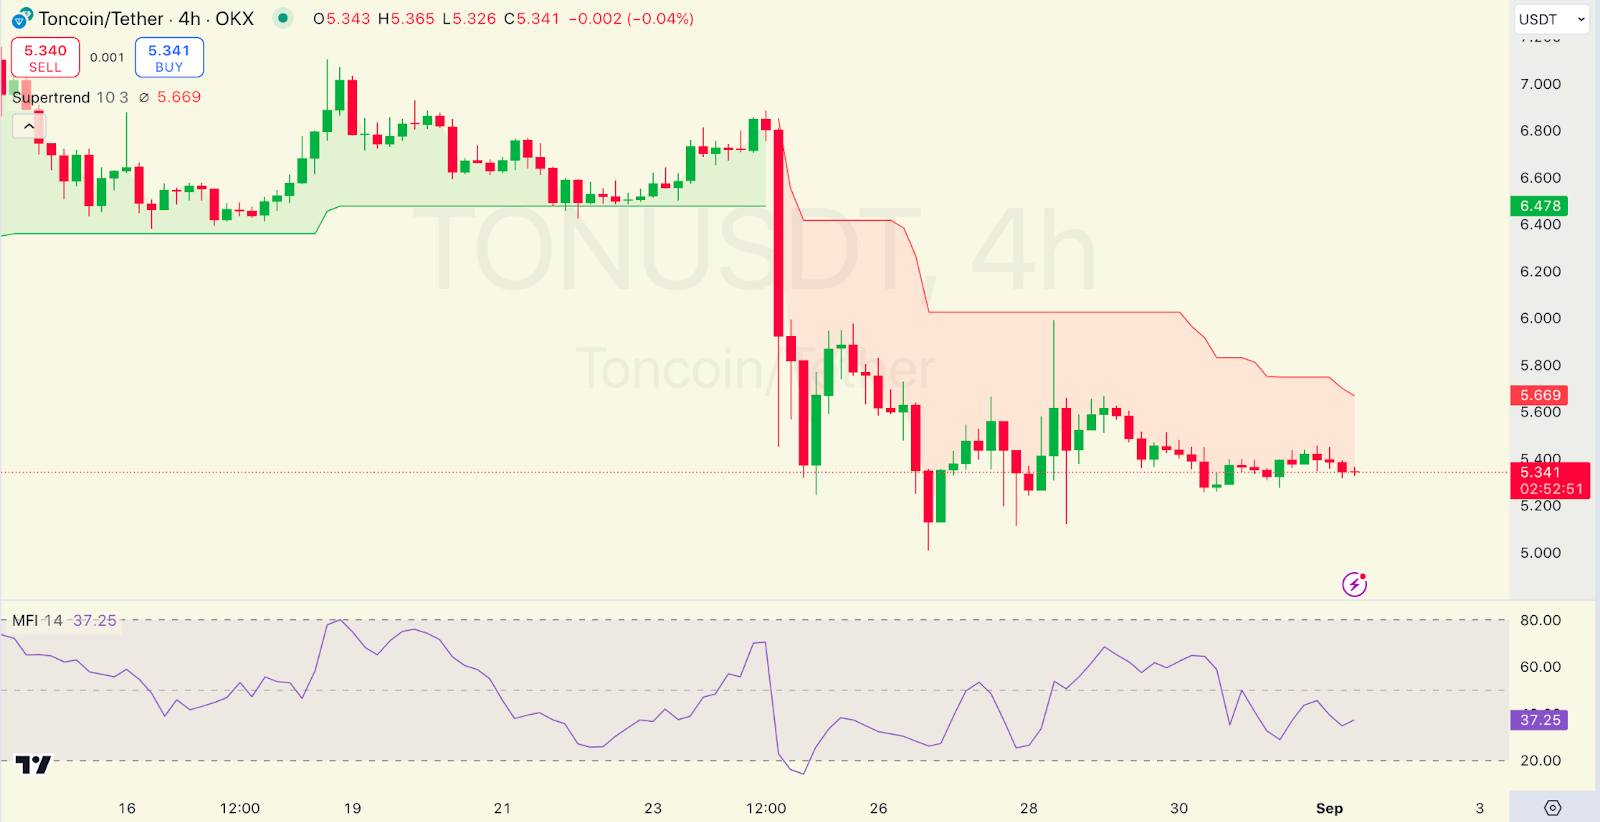
Toncoin, $TON, is among the gainers in today’s session as also seen from its price movements. Looking at an in-depth analysis, we see that the Supertrend indicator is currently in the red zone, indicating a bearish trend. The price is below the Supertrend resistance level at around 5.669.
On the other hand, we see that the MFI is at 37.25, indicating that the market is neither overbought nor oversold but is closer to the oversold region. Toncoin traded at $5.3 as of press time, representing a 0.05% increase over the last 24 hours.
Beam Price Review
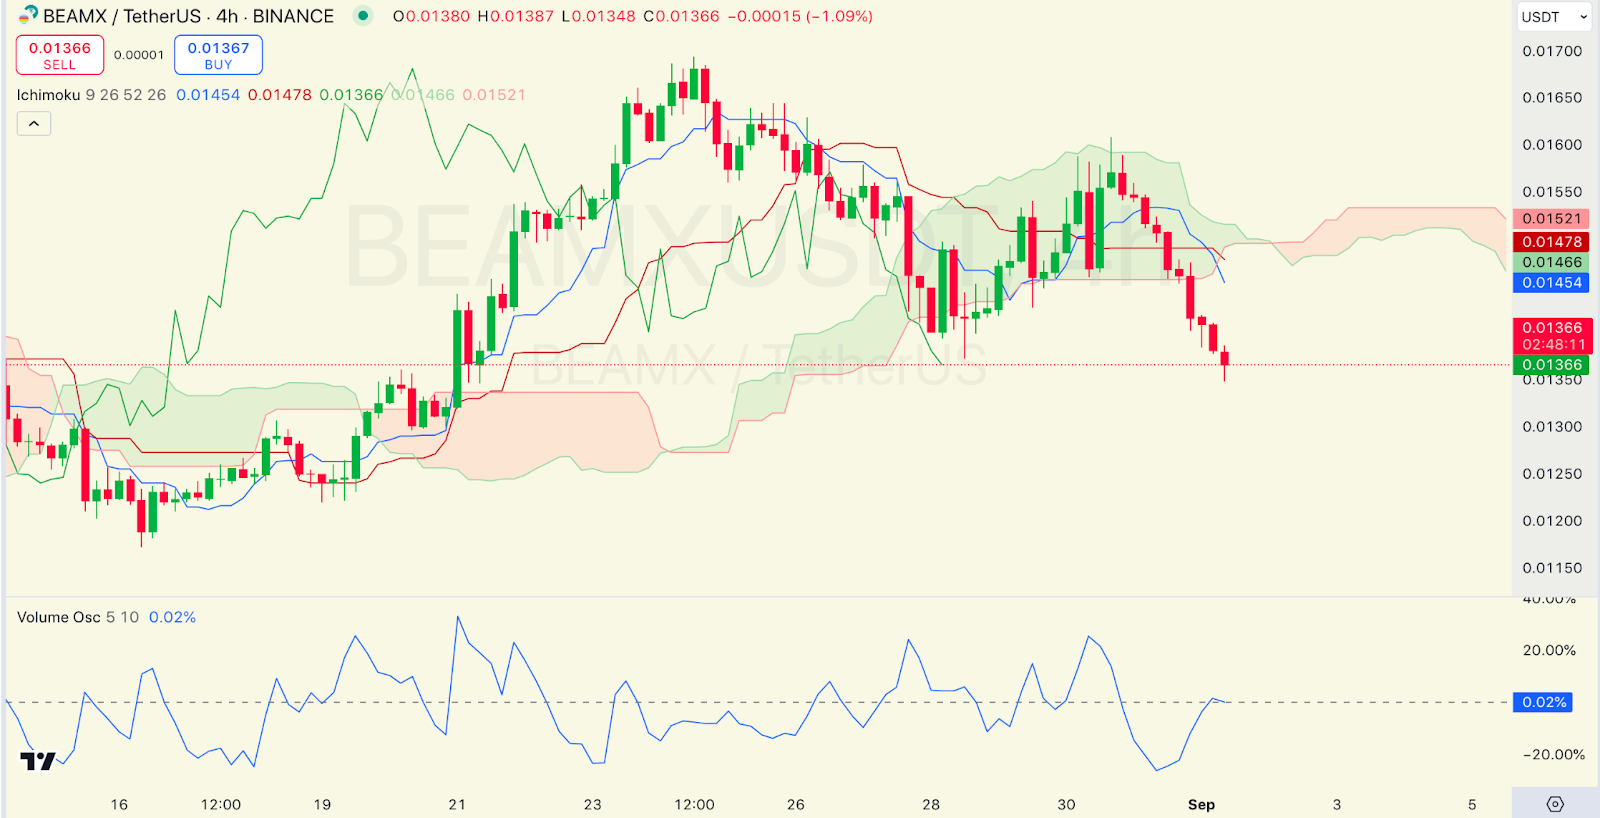
Beam, $BEAM, is not among the gainers in today’s session as also seen from its price movements. Looking at an in-depth analysis, we see that the BEAMX is trading below the Ichimoku cloud, which is a bearish signal. The Tenkan-sen and Kijun-sen are both above the current price, further supporting a bearish outlook.
On the other hand, we see that the Volume Oscillator is low at 0.02%, indicating low trading volume, which could signify a lack of momentum in either direction. Beam traded at $0.01351 as of press time, representing a 10.98% decrease over the last 24 hours.
Brett Price Review
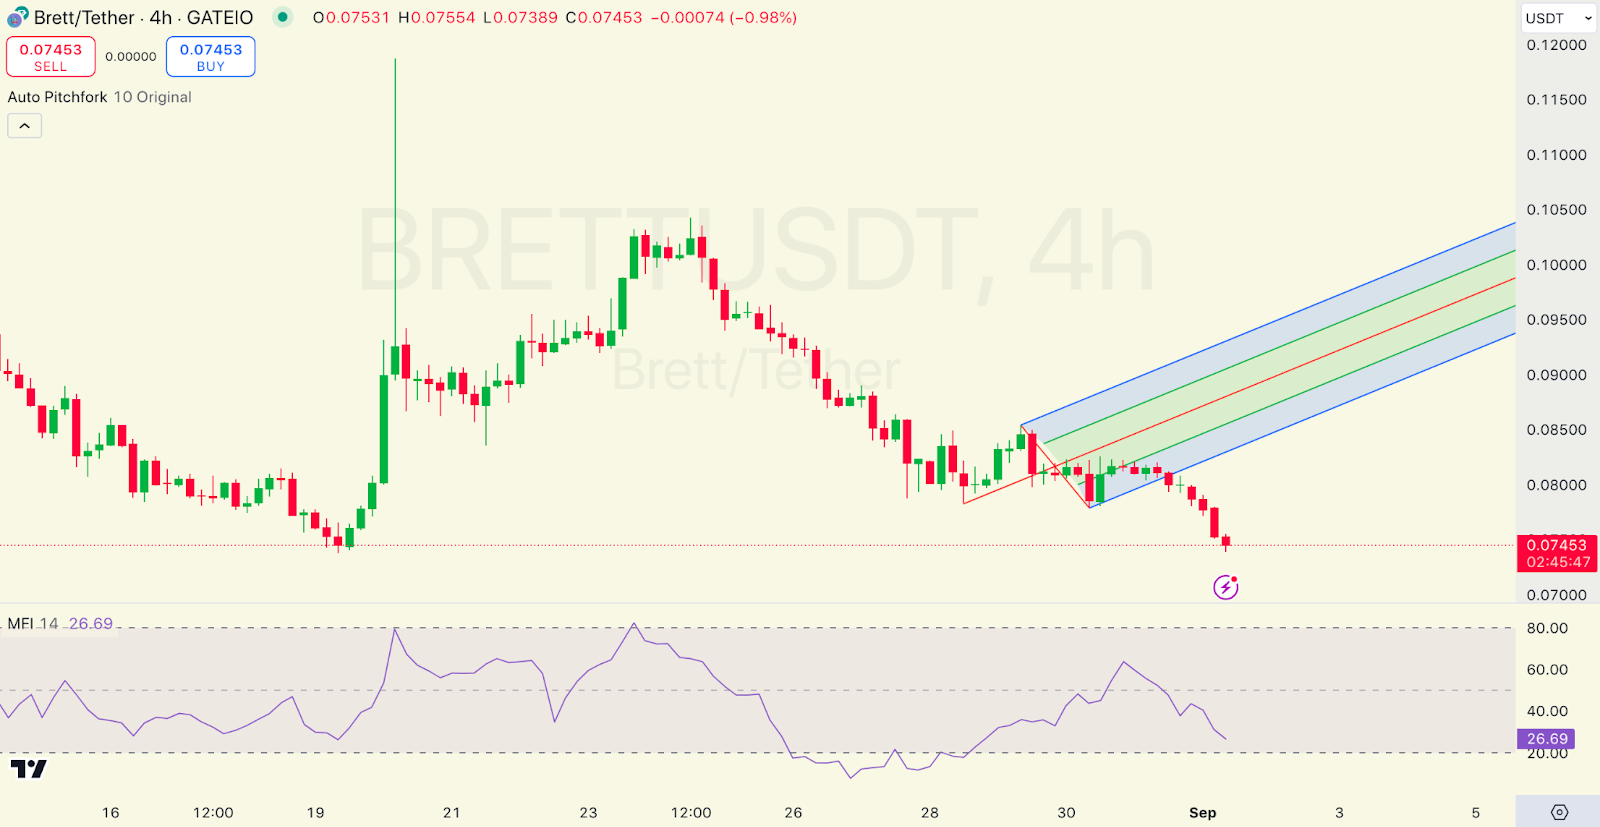
Brett, BRETT, is not among the gainers in today’s session as seen from its price movements as well. Looking at an in-depth analysis, we see that the the Brett price is trending along the lower boundary of the pitchfork, indicating a bearish trend. The failure to break above the middle line suggests weakness in upward momentum.
On the other hand, we see that the MFI is at 26.69, indicating a bearish sentiment as it is below the neutral 50 level. Brett traded at $0.07407 as of press time, representing a 9.19% decrease over the last 24 hours.
